Thursday, May 30, 2013

Economics as a counting problem

A quick note: The information transfer model is basically a counting problem: you have a long measuring stick that changes by some amount and you are determining the effect of that change on another long measuring stick.
Looking at an instantaneous snapshot of the economy, an individual has a set of allocations of current credit + cash to various goods and services over time. A car payment continues for the next couple years while a chair is a one-time expense. An individual's allocation (not showing the unused quantity) is then very much like an integer partition (a Ferrers diagram):
The interesting thing is that as the number of elements goes to infinity, the instantaneous allocation of every business, individual, etc looks more and more defined/tractable as an ensemble:
... and you could imagine a statistical mechanics (or information theory) approach would capture much of the phenomena.

Rescaling and inflation

As mentioned, the assumption that the observed price forms a lower bound on the information transfer leads to a steady drift towards the center of the area between the observed supply curve and the ideal supply curve. I decided to see what you get if you took that price as a "real" price and posited that the nominal price is "rescaled" such that the real price remains at the lower bound. The absolute value of the price level is somewhat arbitrary and most economists believe that simply adding zeros on a dollar bill should have no effect (more on this later).

Here I rescaled a fluctuating price level such that it was always at the lower bound curve. This changes the average effect of fluctuations: sticking near the lower bound means that fluctuations downward are cut off, hence a tendency for the price to rise instead of simply a drift towards the center of the red band in the image below.
A sample path is in light green, the mean path is in dark green, and the rescaled (real) quantities are shown in light gray and dark gray respectively. The "real" price level is stuck at the lower bound by construction:
The resulting mean output (dark gray) stays at a roughly constant level (interestingly, a sample path in light gray oscillates randomly back and forth between a high and low level, corresponding to the width of the red band -- business cycles?):
The required rescaling values per time step for all the 100 sample paths look like this (the mean is shown in green in the second graph):
If we perform the product on each time step, we get an exponential curve (the first graph shows a zoomed in version to emphasize the difference from the linear change shown as a dashed gray curve):
I'm just playing around here, but maybe this is one source of inflation. I originally just wanted to try and design a system that would be stable in some sense (here, the real price level). I referred to this drift as the "irreducible" part of inflation earlier; there is a "direct" piece that comes from simply increasing the money supply (quantity theory of money) that dominates for high levels of inflation. I will have to work through these in more detail in the future. 

However! During the course of running these models, I got interested in a new idea related to renormalization in physics. The thing is that the "price level" is actually a somewhat arbitrary definition -- you can rescale the nominal value of currency and it should have no effect. Similarly, we don't really know what the charge of an electron is -- the theory tells us how it scales with energy but it doesn't tell us what the absolute value is. We measure the charge at one energy and QED tells us what it is at all energies. It seems to me to be likely that a macroeconomic theory should similarly tell you the dynamics of the price level, but not its absolute value (due to a rescaling freedom). You'd measure it at one point and then know how it behaves. (Not determining the price level is considered a flaw, e.g. here; however the IS-LM model does not determine the price level and seems relatively successful).

The adding up of Feynman diagrams is my intuitive picture of adding up expectations and transactions in the economy -- and it turns out that things work if you use the "nominal" values (the measured electron charge) in the tree-level diagrams (no loop) in calculating amplitudes. Again, IS-LM doesn't even take into account the difference between real and nominal interest rates! Maybe money illusion is the result of summing up all possible interactions. 

FYI, I am just "thinking out loud" here and I would like to put this all in a much more rigorous framework eventually. The rescaling here is not necessarily consistent with the previous talk of sticky prices or a vertical supply curve, either. Slowly working the details ...

Monday, May 20, 2013

Money is an amoral tool and other observations

If this information transfer model of economics is correct and can be extrapolated to macroeconomics then it is interesting (to me at least) to think about the consequences:
  • Money as such (including short term treasuries or other things measured in monetary aggregates) can be thought of as something closer to bandwidth that doesn't have as many moral implications including those around thriftiness, poverty, entrepreneurship or "hard money" as it is imbued with by e.g. advocates of the gold standard. Money is an amoral tool that allows information to get from one place to another. Given that, there is still a strain of thought in computer programming that sees using more than the bare minimum of resources as something of a moral transgression.
  • Looking at the Shannon-Hartley theorem, in order to allow more information to be transferred (economic growth), you must increase the "bandwidth" (money supply). This is a necessary, but not sufficient condition. In the case of a noisy channel, increasing the "SNR" or improving your coding will also allow more information transfer (the latter will increase the time it takes to transfer the same information). As will making the information transfer more "ideal" (i.e. $I_{Q^d} = I_{Q^s}$). Of these latter three, only the third (ideal information transfer) has an obvious analog of making markets more transparent.
  • As an aside on the the last point: a real number with random fluctuations on the order of a percent (20 dB SNR) has a limited channel capacity to transfer information. Assuming a single precision number and a best case micro-second scale for HFT, we can put a limit of $C = B \log_{2} (1 + SNR) \simeq 200 \text{ Mbps}$ that can be transferred through a single price market mechanism.
  • Assigning properties of the macro theory to the micro theory is nonsensical; diminishing marginal utility is not a quality of an economic agent, but rather a quality of an ensemble of such agents. When moving along the demand curve, the price one is willing to pay appears to fall. Translating this to the thermodynamic analogy the ridiculousness becomes obvious: it says "when undergoing an isothermal expansion, the pressure an atom is willing to exert falls because of the diminishing marginal utility of extra volume". Diminishing marginal utility for goods is actually a sign choice and is due to choosing demand as the information source rather than destination.
  • Money illusion appears to be directly related to the assumption that economic agents use the current price as a lower bound on the supply curve for non-ideal information transfer and hence a lower bound on the ideal information transfer price. First, it leads to sticky prices. And second, such a lower bound cannot be logically combined with an expectation of future inflation (else that future price, which should still be bounded by the ideal supply curve, could be deflated back to become the basis of a new estimate of the lower bound for the current price). This mechanism does not work as well if inflation is high: in such cases there is a deterministic element such that if the Fed says inflation will be $x$ regardless of economic conditions, you best plan on $x$.
  • The IS-LM model can also be seen as a supply and demand system and can therefore be described in the same way as AS-AD. The IS market transfers information to the LM market via the interest rate. However, this market will fail to transfer information if it encounters the zero lower bound -- in the thermodynamic analogy, this is akin to attempting to describe a system with zero pressure (and contradicts the assumptions made that e.g. the price is non-zero). There are some attempts to work around this failure, such as using inflation targeting to make the zero lower bound on the nominal interest rate into a lower bound at (minus) the inflation rate for the real interest rate, but that again runs into problems since the inflation rate is generally not expected to be large compared to the nominal interest rate.
  • One can cast elements of current economic debate in this framework: the interest rate operated as the primary information transfer mechanism from aggregate demand to aggregate supply (in this case, a proxy for AD and AS in the IS and LM markets, respectively) for many years in the US (since, say, the 1980s). Not only did this start far from the zero lower bound, over time it appears to have approached ideal information transfer such that uncertainty was small compared to the levels (the great moderation). As we approached the zero lower bound, the information transfer mechanism began to fail. The information from the aggregate demand was not reaching the aggregate supply and there was a drop in aggregate demand, causing a recession. Different solutions have been proposed. One is to assume that once the price goes to zero, the government as a large piece of aggregate demand can start buying goods and services (or give money to people who will buy goods and services) without regard to a market mechanism -- in a sense assuming aggregate demand will return to its previous level eventually -- until the IS/LM market is functioning again (interest rates rise, or inflation causes the nominal interest rate to rise). This is Keynesianism. A second is to try and create inflation via some existing market mechanism (inflation expectations/inflation target, monetary base expansion/QE) in order for the real interest rate to go below the zero lower bound and either allow the IS-LM framework/interest rate price mechanism to function again (I assume). This encompasses a set of monetarist views. A third is to create a new price in a new market that will function when the IS-LM model fails (and/or replace it). This view includes switching to NGDP level targeting using an NGDP futures market. There are also combination views. [Note: I chose these example links somewhat arbitrarily. They aren't the best exhibitions of the ideas, but rather the first relevant things that came up after some Google searches ...]
  • A note on the previous point: one problem with creating new markets or using different channels is that the information transfer is likely highly non-ideal in the beginning. It is a bit like being unable to talk on your cell phone because your voice plan got too expensive and deciding to revert to text messages at a time in the past when text messages hadn't been used all that much. You are still trying to communicate the same information, but now you are limited to 140 characters (well, when texts were new they were ...). All kinds of emoticons and abbreviations were invented and became part of the culture to overcome these limitations and try and restore the information transfer capability of speech (yes, emoticons came way earlier, but you get the idea). In a similar sense, a whole language was developed around the interest rate targeting mechanism of the Fed. A new channel is going to take some time to start transferring as much information as the interest rate in the IS-LM framework. One way to visualize this is as two different lower bounds on the ideal price (see figure below). The darker region represents the lower bound from, say, the interest rate market and the lighter region represents the lower bound from the inflation expectations market (the top red curve is the ideal information transfer supply curve in this picture).

Macroeconomics as information transfer

Is it possible to do a simple extrapolation from the generic supply and demand model to an aggregate supply (AS) and aggregate demand (AD) model? We can identify the information source as the demand and the destination as the supply; we can identify the "price" (the information transfer detector) as the price level in the economy. With this dictionary, many of the previous results carry over: the normal heuristics for shifts in the supply and demand curves apply and we have sticky prices. We can draw the same economic "forces" (left, below) for systems out of equilibrium (here a downward shift in AD), and have what appears to be a downward sticky price level in the traditional economics view (right, below):
If we use "rational expectations" (as defined for this model where given non-ideal information transfer, the observed price is a lower bound on the AS curve, i.e. the black dot on the dashed line in the graphs above), then there is a tendency (on average) for the price level to drift upward until it approaches the center of the uncertain band:
A sample path and the average are shown in the figure above. A question: is this inflation? Is it the tendency for people to think observed prices represent a lower bound of the best estimate, and because it is a lower bound, this estimate will tend to drift upward? This is likely an irreducible part of inflation: for high levels of inflation, inflation is primarily a monetary phenomenon (as Milton Friedman said) and the quantity theory of money is a fairly good model. This drift would only be important/noticeable for low levels of inflation. If AD moves upward in this picture, the price level moves upward to follow:
In the figure above, we show the price level drifting upward with a rightward shift in the AD curve, and there is an increase in the price level (blue curves are with AD shift with average being the dashed curve, gray curves are as in graph above):
Interestingly, including the sticky prices (above), we obtain an AD/AS model that appears in the traditional economics view to have a sharp right angle (dashed red lines) at the current price level for shifts in the AD curve:
This recovers the modern view of the AD-AS model: if output falls below its equilibrium the price level doesn't fall due to sticky prices and instead resources are idled (unemployment, empty storefronts, auto assembly robots turned off) and output is reduced. Policies to boost AD will restore the original output level without producing significant inflation. However, policies to boost AD from the equilibrium point will only cause the price level to drift upward without any increase in output (inflation). Note that the classical view holds that the AS curve is purely vertical.


Friday, May 10, 2013

What is arbitrary here?

After the previous post, I decided to try and make a list of the unfounded assumptions or non-mathematical arguments made in the blog thus far.
  • The identification of the price as the "detector" of an information transfer model of supply and demand is the fundamental assumption of the model. However, to get the basics of the theory right, the demand must be the information source and the supply the destination for the signs to work out right (i.e. having the model show that more demand given fixed supply causes prices to go up as well as reproducing diminishing marginal utility).
  • We assumed the Hartley definition of information content (we could use Shannon/Renyi ... though Hartley is Renyi for $\alpha = 0$, and Shannon is Renyi for $\alpha = 1$). It implies all states are equally probable.
  • That the "observed" price forms some kind of lower bound on the supply curve. This is, in a way, the "rational expectations" of this theory: if you know that the best you can do is ideal information transfer, you know you are below the "ideal" price. I don't know if the ideal price is something to which you'd want to peg your expectations, though. However, this assumption does not do as much work as it seems. You would get sticky prices for any starting point (assuming the forces in the next bullet) -- however if you start close to the lower bound, prices are typically sticky downward and if you are near the upper bound they are sticky upward. This also leads to an upward drift (if you start near the lower bound) downward drift (starting near the upper bound), ending when you reach the center. This means the assumption (again, assuming the forces in the next bullet) is not stable.
  • That the observed price experiences no upward or downward force inside the uncertain region. I made an argument for this here. That is just an argument based on the idea that the demand curve is based on the information source and the supply curve is based on the information destination.
  • You might think choosing a point near the center of the uncertain region would be stable -- however if you don't know the distance to the ideal supply curve, then you can't know where the center is. If you did know the distance to the ideal supply curve, then somehow the demand information gleaned from the ideal price is being transmitted to you (when we chose $I_{Q^s} < I_{Q^d}$).

Sunday, May 5, 2013

What picture of economics is emerging?


I'm not going to answer this definitively; I'm just going to give some preliminary thoughts in bullet point form:

  • The "invisible hand" is a result of the dynamics of an information transfer process from something identified in economics as the "demand" (which is a nebulous concept based on consumer desires and abilities) to the supply (which is a fairly well-defined concept based on physical widgets or services). The price is what detects a demand signal being sent to the demand.
  • In particular, these dynamics arise without any particular description of the micro theory: the reason the supply curve is upward sloping and the demand curve is downward sloping is a result of the price detecting information being transferred from the demand to the supply. Marginal utility may help explain a micro theory, but it is unnecessary to derive the basic results.
  • Additionally, the information transfer model does not require equilibrium and therefore can operate when the system is not in equilibrium (as long as $I_{Q^d} \sim I_{Q^s}$).
  • Since the information source is the demand, the idea that "supply creates its own demand" is on the whole false since the information destination cannot create the information so destined. Supply can uncover demand (i.e. information that used to be transmitted from the source into "empty space" can suddenly have a place to go).
  • The price is a way of "detecting" the process of transmitting information from the demand to the supply, so in a sense, money is a unit of information that at a basic level only has meaning in what demand it can be used to transmit information to what supply.
  • As a corollary to the previous point, anything that behaves like supply and demand with something functioning as a price can be put in this framework. For example, the IS-LM model behaves like supply (LM) and demand (IS) curves with the interest rate functioning as the "price". So does the AD/AS model with the "price level" functioning as the price.
  • Prices can be sticky if information transfer is non-ideal. Again, this is based on non-ideal information transfer and does not depend on a particular micro theory (menu costs, money illusion, signalling) -- a micro theory is unnecessary.
  • If $I_{Q^d} \gg I_{Q^s}$ or the price becomes undefined, then the information transfer mechanism breaks down and there might not be any kind of market at all
  • One could take this further and make the argument that $I_{Q^d} \sim I_{Q^s}$ represents a condition for a well defined concept of "economics" to exist, and that studying things where little information is transferred by a ill-defined price is actually something else ... like sociology. Does market failure represent a boundary of applicability in a similar way that nonequilibrium systems can lack a well defined concept of temperature? 

Saturday, May 4, 2013

Other aspects of price changes under demand shifts with non-ideal information transfer

Some more modeling following the previous post; in here we have a larger shift in the demand curve and a representative random walk of the price
 
Averaging over many paths, we get sticky prices, followed by a fall in price toward the new equilibrium
The prices are just sticky downward; upward shifts in the demand curve are accompanied by immediate reactions in the price
And again, the average
These two results in the traditional economics textbook pictures would look like this

Sticky prices

I'll start with the non-ideal information transfer picture where we assume the current price as a lower bound on how far away from ideal information transfer we are (i.e. the observed price is not the worst estimate of the ideal price).
If demand suddenly shifts lower (our constant information source drops $Q^d_0 \rightarrow Q^d_-$), the observed price will undergo a "force" to regain equilibrium, much like an ideal gas in a container where the temperature is decreased will either have the pressure or the volume (if allowed) will drop. In the case of ideal information transfer, we have restoring forces in 2 dimensions pushing the current price to the new equilibrium price. However, when there is non-deal information transfer, inside the uncertain region (shaded in red in the figures above and below) there is to first approximation no restoring force moving the price. In this figure, we show the directions of the restoring forces inside the different regions after a shift of the demand curve:
The demand curve represents the constant information source, therefore the quantity supplied (the information destination) will undergo forces acting to the left or right, depending on if the equilibrium (in the quantity dimension) is to the right or left of the demand curve. The price (the detector) will only experience a force if the equilibrium is above or below the uncertain region of the supply curve. The picture we should have is of a pressure vessel with a broken pressure gauge. If the temperature drops, the equilibrium will move to a point on the volume curve but that change may not register on the gauge.

Now assume that the price moves according to a Wiener process (random walk). If there were no forces (drift) then the price would move in a random direction and an ensemble would appear to diffuse outward from the starting point (our observed equilibrium).
If we include the forces and look at the case where there was no shift of demand, we see that the price randomly walks along the demand curve inside the uncertain region
The price versus time graph looks like a random walk
Now let us introduce a shift in the demand curve; the price then undergoes a random walk that drifts toward the new demand curve
And the price still looks like a random walk
However, if we average many such walks, we see a different price behavior
The price appears to stick near the original equilibrium
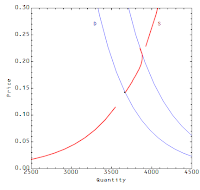
This will occur whenever the uncertain region between the demand curves is roughly symmetric along a horizontal line through the original equilibrium price or the regions above and below are sufficiently large for the top and bottom of the rough parallelogram to be considered far away from that horizontal line. What does this look like from the traditional economics perspective? You get a supply curve that flattens for downward/leftward shifts in the demand curve
Note that the price eventually drops to a price consistent with the new demand curve (it will randomly fluctuate along the new demand curve much like in the figure shown earlier).

Sticky prices are an important component of modern macroeconomics -- they are a way of saying "No, wait, demand shocks could matter as well". Keynesian and monetarist economics are based on the idea that prices don't necessarily fall to clear markets (they agree on macroeconomic stabilization policy, just not on what kind). However, these results don't completely counteract the "classical" claim, which in this framework would say that we always have ideal information transfer $I_{Q^d} = I_{Q^s}$ so that the price always falls in response to a demand shock. This seems unlikely in my own personal view.