Saturday, April 30, 2016

So is science a science?

Arthur Yip on Twitter asked Noah Smith about the "101isms" in this article from a few years ago about by Michael Lind. The first myth is kind of a distillation of what many people think about economics as a science -- i.e. that it's not.
Myth 1: Economics is a science. 
The way economists maintain stature in public policy circles is to present their discipline as a science, akin to physics. In Econ 101, there is no uncertainty, only the obvious truths embedded in supply and demand curves. As noted economist Lionel Robbins wrote, “Economics is the science which studies human behavior as a relationship between given ends and scarce means, which have alternative uses.” If economics is actually a science, then policy makers can feel more comfortable following the advice of economists. But if economics were really a science – which implies only one answer to a particular question — why do 40 percent of surveyed economists agree that raising the minimum wage would make it harder for people to get jobs while 40 percent disagree? It’s because as Larry Lindsey, former head of President Bush’s National Economic Council, admitted, “The continuing argument [among economists] is a product of philosophical disagreements about human nature and the role of government and cannot be fully resolved by economists no matter how sound their data.”
Science means "only one answer to a particular question"? I wrote a piece a couple weeks ago taking Daniel Little to task for this erroneous view of what science is -- I called it "Wikipedia science". It views science as a finished product. The answers to the questions all exist. One answer only. I think most people's view of falsification is similarly flawed -- even Popper thought that Einstein's equations supplanted Newtonian physics, which is news to this physicist. More accurately, Newtonian physics is an approximation to Einstein's equations for the kind of scenarios humans in the 1600s found themselves: speeds less than that of light and low gravitational field strength.

It makes sense to me that 40% agree that raising the minimum wage makes it harder for people to get jobs and 40% disagree (leaving 20% in the ¯\_(ツ)_/¯ category, I guess). If you ask physicists about dark energy, you might get similar confusion since we don't know (as a group) the answer. There are probably some physicists who think they know the specific answer, but as a field the collective answer is ¯\_(ツ)_/¯.

Science is a process, not a destination. And it's messy. I think of it more as the blind groping for which economists use the term tâtonnement. And in the history of science, you can see how the theories build on each other -- new theories tend to appear with better capacities to measure as much as new insights into nature. Quantum mechanics happens around the time we could measure the effects of quantum mechanics! These times are are loose -- quantum physics effects started to be measured in the late 1800s and the theory doesn't arrive until the 1920s or 30s. 

I think that is a better way to define what is an isn't a science -- do theories change when newer and better measurements happen? And it works the other way: string theory's status as a science is likely being questioned today because we haven't made a comparable advance in measurement (a lot of the accelerator technology is comparable to where it was in the 1950s, just bigger and more efficient). 

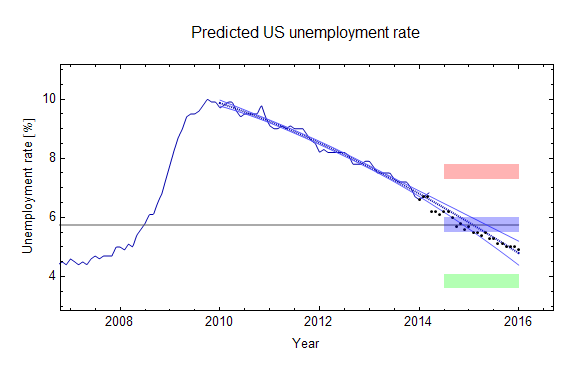
In that respect, economics is a science. There was a major measurement advance that started in the late 19th and early 20th century -- our modern concepts of GDP come from that era. Big ideas in modern economic theory date to those times. I think we are currently in the midst of another advance in measurement with "big data" as well as with the widespread availability of macro data in economics (from databases like FRED).

Maybe questioning economics as a science is like questioning string theory as a science: it has been awhile since the last empirical advance. Economics has been sitting around with the same macro data since the 1930s.

...

PS The figure caption at the article is a bit strange:
... relying on neoclassical economics, as popularized by Ludwig von Mises (left), is like a physicist today relying on Newton.
This is a bit ironic given that von Mises was against using math for economics.

Friday, April 29, 2016

Blog birthday week continues: another successful prediction (GBP-EUR exchange rate)

As part of a series of closeouts (here, here) of forecasts in celebration of this blog's third birthday, let me add the update of this prediction of EUR-GBP exchange rates (new data in black):


I'm sure the ongoing "brexit" campaign is having some influence, so I probably will return to this one.

Update to 2014 IT model inflation forecast vs NY Fed and FOMC

Here's an update to the forecast last updated in February here (see the prediction page). It turns out the large spike in core PCE inflation from the beginning of the year has saved the NY Fed DSGE model from defeat -- and had they kept to their original forecast, it would be doing remarkably well! There's also an update to David Beckworth's corridor, which is also standing the test of time. Because of the spike in core PCE inflation, the IT model is biased a bit low. The FOMC was still wrong in their March of 2014 meeting.

I actually speculated that the inflation spike might be due to the neo-Fisherite model being right. That was really only half-serious as I think the model is fundamentally flawed.


Blog birthday week continues: another successful prediction (EU inflation)

On the 8th of January 2015, I made a prediction for the next year or so of Eurozone inflation. This was before Draghi's announcement of additional QE on January 22nd, as I noted in an update a few months ago. Well, here's the close out of that prediction (I added the one standard deviation error band):


This makes three successes on the prediction page (US interest rates and inflation, Swiss CPI and EU HICP) even in the face of policy announcements (currency pegs and Draghi's open mouth operations -- see also here).

Thursday, April 28, 2016

Celebrate this blog's birthday with a model prediction success story

As part of the celebration of this blog's third birthday, I thought I'd close out a set of predictions I made two years ago.

Updated previously under the heading of "not bad for five parameters" and doing well at the 18-month mark (where you can go if you want to see more details), I get to finally declare victory. One annoying part was that because I used a different convention for labeling data (most of the time I say a quarterly measurement comes at the end of the quarter, but in this prediction I used the beginning of the quarter) it required me to wait until Q1 2016 data was available in order to make it to the forecast endpoint of 2016. Anyway, this morning around 8am EDT the BEA released that data point (it was 1.2% NGDP growth).

The big unforeseen event was the Fed raising its interest rate target in December of 2015. I had tacitly assumed that because the model predicted below-target inflation and moderate real growth that there'd likely be no reason for a Fed rate hike. I guess I got that wrong. But then that meant the assumed path of the economy (for the prediction) diverged from the path it actually took -- and I'm still looking into the impact of the rate hike. If doing this again, I'd also use the average value form (the model represents the average value, shown in the link in the previous sentence) instead of the upper bound form (the model represents the upper bound, which I used for the interest rates). Again, if you want to see more details about the predictions, head over to the to the 18-month update.

One important thing to note is that the interest rate model has two parameters in total. That is to say

{r3m, r10y} = f(NGDP, M0, MB, a, b) 

Overall, however, the predictions were successful, so I'll declare this one a success on the prediction page.

Here are the graphs (I added 2-sigma errors to the CPI and RGDP graphs):


Here are the "nominal shocks" both with mean prediction error (the error in predicting the mean, the smaller error bar) and single prediction error (the error in predicting a single value, the larger error bar):


Here are the assumed (counterfactual) paths that led to the predictions (the monetary base was lower than the assumed path):


Wednesday, April 27, 2016

What is wrong with economics in one chart

Ed. note: I clearing out my drafts of ostensibly blogable material. This is two of two.
Mark Thoma had a link to David Warsh, which made me look up some papers by Michel De Vroey, including this one [pdf]. In that paper I found an excellent distillation of what is wrong with economics. Check out this chart of the evolution of economics starting from a Keynesian initial condition:


The first major problem of economics is demonstrated with the line "Main assumptions: (a) the nature of the shock". The problem? This line is filled out with something. As I have stated before, economists (mainstream and heterodox alike) all seem to operate as if they know the precise nature of economic shocks. Give it up. We don't know that yet. Debt deflation, monetary policy expectations, real business cycles, animal spirits, sunspots, coordination failures, financial crises, whatever it is that Steve Keen is doing -- these are all hypotheses.

This is not solved by any proposed new economic methodology. Even the "new empiricism" that Noah Smith likes to tout is not being conducted in a way to test these different hypotheses against each other. Sure comparing your New Keynesian model to data is a great idea, but systematically comparing one model against another [1]? That's where knowledge begins. However I'll bet you'll find that both models explain the data just as well.

The second major problem (which also shows no sign of changing) shows up in the transitions between the columns. The issue is that new ideas in economics are incorporated into models with zero empirical support for the changes.

Did we learn that an equilibrium business cycle had better explanatory power than inefficient monetary policy between 1972 and 1975? Nope.

Did we learn that microfoundations made more successful models between 1968 and 1972? Nope.

Did we learn that the shocks were monetary between 1936 and 1968? Nope.

Did we learn that monetary policy was irrelevant between 1976 and 1982? Nope.

Did we learn that agents were rational between 1968 and 1972? Nope.

If you disagree, point to the empirical findings that motivate such a change occurring betwen those years.

For modern examples, look to behavioral economics and financial sectors being added to NK DSGE models in the aftermath of the financial crisis. Did we figure out that these were responsible for the failure of the DSGE models between 2007 and 2011? As Paul Krugman frequently points out: Keynesian IS-LM saves a lot of the phenomena.

In each of these cases, the theoretical developments are in response to successes!

Equilibrium business cycles was a response to the relative success that intervention via monetary and fiscal policy had in stabilizing the economy. Likewise for microfoundations and rational expectations. Real business cycles comes right after interventionist monetary policy is credited with breaking the back of inflation.

You can see it in the addition of new effects to NK DSGE models as well -- it happens in the shadow of the success [2] of "paleo-Keynesianism" and "depression economics" in the aftermath of the Great Recession.

...

Footnotes:

[1] I put my money where my mouth is. Here are several predictions with the information equilibrium framework going up against a NK DSGE model, some vague monetarist models, a prediction market, and the forecasts of several central banks.

[2] That other competing theories of the Great Recession explain (or purport to explain) does not detract from the fact that "paleo-Keynesian" models also explain the Great Recession.

Math ≠ utility maximization

Ed. note: I clearing out my drafts of ostensibly blogable material. This is one of two.

Lagrange multipliers for utility maximization

Mike Sankowski still thinks I've missed something about the complaint about math in economics. I actually agree -- there is something baffling (to me) about this complaint. Maybe Loonie on twitter puts his finger on it: abstractions are scary.

A commenter sent me a link to a paper by Tony Lawson, which after I stripped it of its pompous verbosity seems to say the problem with economics is that it insists on using math to describe things that happen more than once.

I sent out a tweetshower (not quite a storm) asking if there was some feature of the economy that wasn't represented as a number because otherwise there'd be no reason not to use math.

Triangulating using the Lawson paper and the original Aeon article that set the whole thing off, I think I've come up with another thread I missed. I think people who decry the mathematization of economics are doing one of four things:
  1. Denying that economics has any regular features that math can be used for
  2. Equating math with utility maximization (or DSGE, or whatever framework)
  3. Equating so-called "unrealistic assumptions" with something that is incorrect
  4. Feeling left out because the math is impenetrable but are interested in the subject
Three of these I've dealt with before. Number 1 needs some proof; you can't just assert that and think you're being a very serious person saying economics is really complex. No one has proven economics isn't amenable to human understanding and assuming it is true is very un-serious. Number 4 was the subject of my previous post on math in economics.

Number 3 misunderstands what science is all about. Every theory is an effective theory with certain scope conditions. Sure rational agents don't work very well for individuals, but there's no way to know if rational agents can't be used to understand any economics. Maybe they are emergent. Maybe they are an effective theory near an equilibrium. You couldn't have read the back of the book of the universe and found out the answer is not some theory that expands around a rational agent ground state.  In fact, here is some evidence that the neoclassical rational agent model is in fact emergent from irrational agents. So stop saying rational agents are unrealistic. Rational agents are an unrealistic model of N = 1 humans, but pretty good for N = 24. Scope conditions, people!

But the thing that irritates me most whenever the phrase "unrealistic assumptions" is used (for example, in the Lawson paper) is that everyone makes unrealistic assumptions about things all the time. Without additional information, we assume the weather today will be similar to yesterday. This is an unrealistic Markov model (you probably didn't know you were doing this, but your brain does) compared to a NOAA simulation, but it works pretty well. A lot of engineering models are unrealistic models that just fit the parameters to the system they are looking at. A resistor isn't going to be perfectly linear, and simply characterizing it as a resistance R is a massive oversimplification of the complex interaction between electrons and the atomic lattice. But it works. Focusing too much on how unrealistic it all is to say acceleration due to gravity is constant (near the Earth's surface) instead of resorting to Einstein's field equations will paralyze you from making any progress in understanding.

....

Number 2 is new (for this blog). This realization illuminated a certain kind of comment I've gotten on my blog since the early days: there were objections to the mathematical framework simply because it is a mathematical framework -- regardless of its content or results.

This is a bit different from an objection to math itself, although it is frequently (and confusingly) couched as such. It is also referred to as a critique of "methodology". Those raising this objection aren't necessarily objecting to the numbers that are used to describe the economy, but rather to the tools economists have learned and taught the newer generations. But it's the poor craftsperson that blames the tools.

It's a bit like someone standing next you while you are working on your car and asking: Are you going to use a torque wrench on that? I wouldn't.

You need to reinstall the carburetor fluid and charge the crankshaft to prevent side-fumbling. Image from Wikimedia Commons.
The problem with this critique is that we have no idea how to figure economics out yet -- mostly because we haven't already done it. You can't know if a torque wrench is the right tool until someone has written the repair manual. Since none of us really know what is going on, I can be pretty sure some anonymous commenter insisting economics is too complex for information transfer models is probably basing that on a gut feeling instead of any real knowledge.

In physics, we know the Lagrangian approach is good because it has already worked. But the converse is not true -- if we hadn't seen that it worked, it doesn't mean the Lagrangian approach is flawed. As they say with aliens, absence of evidence is not evidence of absence. This is the logical error that people who decry various mathematical approaches make. That some mathematical approaches to economics haven't worked does not mean none of them will ever work.

The other problem with objecting to frameworks is that some kind of framework is necessary otherwise it's all talky philosophy that may be fun for people who do not want to arrive at conclusions, but isn't for the more pragmatic among us. I've written a lot about frameworks. You can see more here, and here's one about how DSGE isn't really a framework.

...

I think the biggest problem with the idea that mathematics the problem (or econ math is a problem, or that econ math is ideological, or that social science aren't amenable to math) is that is obscures the real problem.

Economics might not have a lot to do with people -- at least when markets are working.

No really!

What we think of as regularities in economics might just be properties of the state space. And the failures -- those are social science, psychology and neuroscience!

Monday, April 25, 2016

Happy birthday, blog!

Yesterday was this blog's 3rd birthday. The real celebration will come at the end of this week with the release of GDP data from the BEA. In the meantime, there are a couple of updates:

For the book, I've reached 10,000 words -- a third of my 30,000 word goal. It's turning into a pretty strong indictment of economics in general.

On the blog, I updated the comparative advantage post which has gotten a bit more interesting.


Here's a list of the top posts (by pageviews) of all time:

Mar 3, 2016

Not only did my criticism of the Stock-Flow Consistent (SFC) approach top the pageviews, it topped the list of the greatest number of comments (at over 200).

Jun 19, 2015

My criticism of Scott Sumner's "proof" of monetary offset and that fiscal stimulus has no impact also kicked up a hornets' nest.

Apr 7, 2015

I tried to get a quick summary in front of Mark Thoma because he had just written an article that seemed to be a RFP for the information equilibrium model.

May 16, 2015

Paul Romer makes the same mistake Robert Lucas makes, which began my slow realization that economists don't understand that infinity is dimensionless.

Jan 25, 2016

My reductio ad absurdum model. Inflation is directly linked to labor force participation growth.

Thursday, April 21, 2016

Comparative advantage from maximum entropy

Paul Krugman has a post that is mostly about what using basic economic arguments to advocate policy positions glosses over, but in it he mentions comparative advantage:
Comparative advantage says that countries are made richer by international trade, even if one trading partner is more productive than the other across the board, and the less productive country can only export thanks to low wages. Paul Samuelson once declared this the prime example of an economic insight that is true without being obvious – and to this day you get furious attempts to refute the concept. So comparative advantage has, for generations, been considered one of the crown jewels of economic analysis.
Crown jewel, huh?

Sounds like an excellent example to show the power of a maximum entropy argument. Let's start with the example at Wikipedia (following Ricardo) where  England and Portugal both produce wine and cloth, and Portugal has an absolute advantage to produce both goods. Here's the table from Wikipedia:


Per the article, we'll take Portugal to have 170 labor units available (defining the state space or opportunity set) and England to have 220. The maximum entropy solution for the two nations separately are indicated with the green (Portugal) and blue (England) points:


I indicated the additional consumption possibilities for Portugal because of trade in the green shaded area. As you can see the production opportunity sets are bounded by the green and blue lines, but the consumption opportunity set is bounded by the black dashed line. This means the maximum entropy (i.e. expected) consumption for both nations is the black point (actually two black points on top of each other -- England gets a bit more wine and Portugal gets a bit more cloth). Already, you can see this is a bit further out are more wine and cloth in total is consumed.

Now we ask: what are the points in the production possibility set that are consistent with this consumption level? They are given here:


In a sense, the consumption possibilities inside the black dashed line makes the production possibility points shown above more likely when considered as a joint probability. That is to say, the most likely position for England's production is the first blue point assuming it can only consume what it produces. This changes if we ask what the most likely position of England's production given it can consume a fraction of what both countries produce.

As you can see Portugal produces more wine and England produces more cloth -- the goods each nation has a comparative advantage (but not absolute advantage) to produce. When trade is allowed, the production of each nation moves to a new information equilibrium:

...

Update 25 April 2016

In checking the results for material in the book (I'm at 10,000 words, 1/3 of the way to my 30,000 word goal), I realized that something I did to speed up the calculation actually made the comparative advantage result less interesting by eliminating a bunch of valid states where England specializes in wine and Portugal specializes in cloth.

It turns out that trade is still likely, even in the case where one nation is more productive across the board, but it is only marginally more likely that one nation will specialize in the good for which they have a comparative advantage.

In the England-Portugal example, it is only slightly more likely that England would specialize in cloth. There is a significant probability that England could specialize in wine (at least if the numbers were given as they are above).

This is interesting because it produces an evolutionary mechanism for trade. A slight advantage turns into a greater and greater advantage over time. This fits more into the idea of agglomeration (increasing returns to scale).

Additionally it explains why e.g. bacteria would trade metabolites without resorting to rational agents.

Here are the opportunity sets consistent with the maximum entropy consumption solution:


And here is the combined diagram:


Update + 1 hour

Also, this is more consistent with the data. See this paper [pdf]. Here's a quote:
While the slope coefficient falls short of its theoretical value (one), it remains positive and statistically significant.

Wednesday, April 20, 2016

A random physicist takes on economics

Blueberry. Kevin Payravi, Wikimedia Commons
Sorry for the fall off in blogging of late. It's probably going to continue for a bit. Why? As I mentioned on Twitter last night, I've decided to write a short book about some of the subjects I cover on my blog. The intended audience will be people without technical backgrounds.

My goal is about 20,000 to 30,000 words, which is about one to two month's worth of posts at my current rate. The goal is publication in September. In a sense, I want to try and write something on the scale of Tyler Cowen's The Great Stagnation aimed at a similar audience, even using a similar publishing method: as a Kindle e-book with an eye to being released as a Kindle Single.

The working title is A random physicist takes on economics.

The current draft material is already about 6,000 words, including some outline segments. If that current material is any guide, the book's tone is going to be very critical of economics as a discipline. Those critiques are centered around random agents describing things just as well, the nonsense and complete lack of discipline that goes under the general heading of "expectations", calling out Hayek's version of the price mechanism as nonsensical, and the complete detachment from reality that is the mathematics used in economics. There will even be some policy implications. It's something I've avoided doing too much -- tending to advocate a kind of nihilism. However, I see a place for some of the broad conclusions you can take from irrational agents (don't correlate; explore state space) that could become extremely relevant in the coming years in US politics at least.

I'm not going to discuss the performance of information equilibrium models (or at least I don't plan to [2]), partially because that is too technical and partially because they haven't gone through a real peer review process. Instead it's mostly going to focus on the insights coming from random agents, relying on Gary Becker's 1962 paper "Irrational Behavior and Economic Theory". You could call this a prequel to the blog, or possibly an introductory volume to a series where the second volume is an expanded version of the paper.

In a sense, this is an attempt at an end run around the mainstream political and economic establishment -- a blueberry manifesto [1] people can show on their cell phones.

I don't plan on taking this all that seriously :)

...

Footnotes:

[1] The blueberry picture above -- an edit from one taken by Kevin Payravi and uploaded on Wikimedia commons -- is currently a stand-in for what is eventually going to be part of the book cover. It's a reference to The Velvet Underground's first album, the blue color that I've used on this blog, as well as the pints of blueberries that will feature in the examples (and did here).

[2] The BEA is hopefully going to deliver a nice 3rd birthday present for this blog next week.

Monday, April 18, 2016

Please stop talking about how science works if you don't know

I think I may have a good theory about why most people don't understand how science works. I'm not saying this is necessarily a liability -- most people don't really need to know how science works for their day jobs. However, this turns out to be a serious liability if you want to philosophize about science.

Today, most of the basic things you might ascribe to being the result of science are well-known and captured in well-established theoretical frameworks that themselves capture the empirical successes of the the various fields. That is to say: it's all Wikipedia science. The answers are all online. Therefore most people have no idea how science works to figure out the discoveries behind the Wikipedia articles. It's a messy process; it's definitely not some clean statement of hypotheses, control variables, data and conclusions with confidence intervals.

A good example of this mental frame comes from Daniel Little:
How does a field of phenomena come into focus as a subject of scientific study? When we want to know about weather, we can identify a relatively small number of variables that represent the whole of the topic -- temperature, air pressure, wind velocity, rainfall. And we can pick out the aspects of physics that seem to be causally relevant to the atmospheric dynamics that give rise to variations in these variables.
Nope!

I mean, sure, that is how you go about studying the weather if you've already made major empirical findings and had several theoretical successes on the subject of how weather works. Like today.

But that isn't the way it happened. Let's just take two concepts from that list: temperature and pressue. Early thermometers were also (unfortunately) barometers. The first temperature scale comes in the mid-1700s (F) while barometric pressure had been measured since the mid-1600s (mmHg) ... almost a hundred years earlier. The two devices had entirely different theoretical motivations/constructions: thermodynamics (thermometer) and the vacuum (barometer). Some of thermodynamics had already been worked out before the first quantitative measurements of temperature were ever made -- e.g. Boyle's law (1662). Charles' Law (1802) comes after the development of temperature measurements.

The physics required advances from Newton (1687) through Boltzmann (1890s), and modern computers are required to do the computations for even a small patch of the surface of the Earth. And the number of variables required to understand local weather can reach into the millions (e.g. a DTED survey of the local topography -- one reason Seattle's weather is easier to understand that say Topeka's is that the ocean and geography are very important inputs to forecasts for the former).

Day-to-day weather is still empirically flawed (just check your local forecast). However, at the macro theory scale of fronts and pressure cyclones, there's been successful descriptions (that rely primarily on pressure, mind you) since the late 1800s (from here and here):


...

Since Little's premise is flawed, we can basically conclude that the following post is just a lot of irrelevant nonsense. But let's continue:

Deciding what factors are important and amenable to scientific study in the social world is not so easy. Population size or density? Economic product? Inter-group conflict? Public opinion and values? Political systems? Racial and ethnic identities? All of these factors are of interest to the social sciences, to be sure. But none of this looks like anything like a definition of the whole of the social realm. Rather, there are indefinitely many other research questions that can be posed about the social world -- style and fashion, trends of social media, forms of etiquette, sources of power, and on and on.

Deciding?

In science you would hypothesize that a given factor was important and subsequently study it empirically to figure out if it is. Of course there are indefinitely many research questions -- there are very few empirical regularities around which to base a framework in social sciences.

In contrast to Little's example (and congruent with the reality described above), social sciences haven't really discovered anything yet. There are no concepts like temperature or pressure, so of course deciding isn't easy -- you have to do the discovering first. That's how science works. Imagine trying to understand the weather when you haven't discovered temperature or pressure or ways to measure them? You'd end up with philosophical garbage.

Aside: I know macroeconomists like to defend what they learned in school, but what do you think the likelihood is of any of it being true without first having a few empirical successes? It looks like Okun's law is the only one. So congratulations to everyone out there who understands Okun's law -- you have the equivalent of an economics PhD -- at least the only part that probably won't become irrelevant.

...

After saying that there aren't clear ways to scientifically understand the social world, Little goes on to make very strong claims about understanding the social world:
For that matter, these don't look much like a macro-set of factors that are generated in some straightforward way by the simple actions of individual persons. These social factors aren't really analogous to macro-level weather factors, emerging from the local cells of temperature-pressure-humidity-direction. Rather, these social concepts or constructs are theorized and developed in a complicated back-and-forth by sociologists or political scientists seeking to identify social-level constructs that seem to give some insight into the ordinary and systematic experiences we have of the social world. 
Most particularly, there isn't a natural way of mapping these social concepts into an integrated and comprehensive mental model of the whole of the social world. Instead, these high-level social concepts are partial and perspectival. And this is different from the situation of weather or climate. In the latter domains there are finitely many higher level concepts that serve to characterize the whole of the domain of global climate phenomena. Call this "high-level conceptual closure." There are no questions about climate that cannot be phrased in terms of these concepts. But the social world is not amenable to this kind of closure. We lack high-level conceptual closure for the social world.
I bolded the outcomes of Little's apparently well funded and quite successful research program. Oh, wait. He has no evidence for these claims besides his own lack of imagination. Lack of imagination is not evidence of anything.

I want to reserve particular shock to reading this:
Rather, these social concepts or constructs are theorized and developed in a complicated back-and-forth by sociologists or political scientists seeking to identify social-level constructs that seem to give some insight into the ordinary and systematic experiences we have of the social world
By the "rather", I assume that Little thinks this differs from how science works. But he remains consistent with the total misunderstanding of science in the first paragraph because this is exactly how science works. No really; just change the socials to sciences and you get how science works:
Scientific concepts or constructs are theorized and developed in a complicated back-and-forth by scientists seeking to identify constructs that seem to give some insight into the ordinary and systematic experiences we have of the natural world.
It is no different.

I do not understand why people espouse views on how science works when they clearly do not know. I suppose it is Dunning-Kruger. Additionally, most of these views seem to hold science up on a pedestal -- making claims that science is far cleaner a process and more rigorous that it really is.

Social sciences look like a mess -- completely outside the realm of science -- if it is compared to this erroneous perception of science. But if you compare it to the philosophical garbage that we now laud as the pre-scientific understanding that lead to science, it's really not in that bad of shape. It's like comparing your accomplishments to that of your mother or father. They have on the order of 20 years on you, so your life is going to look like a mess.

Basically we should take Little's title as the current state of social science: defining social phenomena. And that's great!

Saturday, April 16, 2016

Angels dancing at the end of time

This should be considered some notes for a future blog post/paper. I've strung together a series of papers to form an argument. The basic idea is that if expectations far out in the future matter in your model, and you use a model where the actual future value enters (or at least the actual future model value -- model consistent expectations, e.g. rational expectations), then your model violates the central limit theorem (in the sense that it requires you to be able to invert the process). In order for the expected future value in the model to lead to a specific present state, you'd have to be able to distinguish which present distribution lead to the distribution of future expected values. However since a random walk derived from any of the distributions with the same well-defined mean and variance lead to a single normal distribution (universality of the normal distribution), this is impossible.

This is a bit more general form of the indeterminacy problem (lots of different paths are consistent with some future expected value of e.g. inflation). Here, lots of different distributions from which a random walk is generated lead to the same future distribution of values.

But really, this means that the expectations operator -- if it is any way forward looking -- is the inverse of a non-invertible operator (the forward-propagating smoothing operator defined by the central limit theorem -- see the pictures below).


...


One thing to keep in mind when using mathematics to describe physical reality is that you have to be very careful about taking limits. In pure mathematics it's generally acceptable to send a variable off to infinity ... . If you are using mathematics to describe physical reality, then [your variable] might just have 'dimensions' (aka 'units') so sending a dimensionful number off to dimensionless infinity (or zero) can give you weird results. ... the only way you can send it off to infinity or zero is to have another scale ... to compare it to. ... In pure math, [sending two time scales to infinity simultaneously] produces an issue of almost uniform convergence; however, if you're using math to describe physical reality then it is nonsense to send ... two dimensionful scales off to dimensionless infinity simultaneously.


The discount rate [one time scale] ... should be a deep parameter in the Lucas sense (based on how human behavior discounts the future) and the growth rate scale [the second time scale] should be a deep parameter of the economy. So we should find the expected value ... depends primarily on the temporal shape of expectations ... . It should therefore primarily depend on the temporal shape of expectations and discounting when exposed to shocks, since temporary shocks shouldn't change deep parameters ... For example, I can cause the representative household's expected utility of consumption to fall in half by switching from [one discount factor to another]. The difference comes from times ... far out [in the future] ... 


... information ... about the future can potentially propagate backwards into the past. All you need to do is couple [a future time to the present using expectations]. ... But I have an additional critique beyond the basic structure of expectations-based macroeconomic theories that might seem a bit strange and it's related to the causality problems ... What keeps expectations in the future? What prevents expectations of [the future] from becoming the value of [the present]? ... In a sense, expectations can travel from a point the future to the present instantaneously ...
Now what does that backward time translation (i.e. expectations) operator do? Well, it should translate the information in the future normal distribution [of the expected value of a variable] into the present distribution -- but there are an infinite number of different present distributions consistent with a future normal distribution [because of the central limit theorem]. How do you choose? You can't. In a sense, [expectations at infinity] requires you to un-mix the cream and the coffee!

Thursday, April 14, 2016

Neo-Fisherism and causality


Stephen Williamson has a new blog post about neo-Fisherism. Let me first say I think I am coming around to the idea that the New Keynesian model really can have a neo-Fisher solution. You guessed correctly there's a "but" coming. However, first let me show why I don't think it's a weird conclusion.

Let's take a model where the output gap is dependent on (a functional of) expected future inflation

$$
y_{t} \left[ E_{t} \pi_{t+\Delta t} \right]  = H(\pi_{t}, ... , \pi_{t+\Delta t}^{M}, ...)
$$

where $M$ represents some model of expectations. Let's re-write this assuming the model of future expectations depends on the actual value of inflation in the future:

$$
\begin{align}
y_{t} \left[ E_{t} \pi_{t+\Delta t} \right]  &= H(\pi_{t}, ... , \pi_{t+\Delta t}^{M}, ...)\\
&= H(\pi_{t}, ... , \pi_{t+\Delta t}^{M}(\pi_{t+\Delta t}), ...)\\
&= H(\pi_{t+\Delta t}, ...)\\
& \approx h_{0} + h_{1} \pi_{t+\Delta t}
\end{align}
$$

where we do a Taylor expansion assuming the deviation from some constant reference inflation value (that gets subsumed into $h_{0}$) is small. This is the functional form that Williamson shows in his blog post (with $h_{0} = 0$ and $h_{1} = 1/b$)

$$
y_{\infty} = \frac{1}{b}(R - r) = \frac{1}{b} \pi_{\infty}
$$

Basically, if inflation expectations in the future have anything to do with the actual value of inflation in the future, something like the neo-Fisher result can follow.

Now comes that aforementioned "but". But first, as I've looked into before, we need to find out a little bit more about that $E_{t}$ operator. Let me rewrite the operator in terms of a time translation ($\phi$)  and a composition and move $E_{t}$ to the other side:

$$
\begin{align}
E_{t} \; f(\pi_{t+\Delta t}) & = f(\pi_{t})\\
E_{t} \; f \circ \phi^{\Delta t}(\pi_{t}) & = f(\pi_{t})\\
 f \circ \phi^{\Delta t}(\pi_{t}) & = \left[ E_{t} \right]^{-1} f(\pi_{t})\\
 & = U^{\Delta t} f(\pi_{t})
\end{align}
$$

Where we make the identification

$$
U^{\Delta t} \equiv \left[ E_{t}\right]^{-1}
$$

This means the expectations operator is an inverse Koopman operator, which is to say it propagates functions backwards in time (a normal Koopman operator evolves a dynamical system forward in time). This doesn't mean it propagates the actual future backward in time, but rather represents a consistent way to connect the expected future with the observed present.

This gets at some the causality weirdness of expectations -- where expectations at infinity (critical to the neo-Fisher phenomenon) propagate from the (expected) future into the present (see here or here). It occurs in Woodford's neo-Fisher paper (discussed by Noah Smith and Nick Rowe has a good explanation). In another example of the future propagating into the present, here is Scott Sumner.

Now $E_{t}$ translates unobservable perceived information about the future into present observables. That means it translates some future distribution of possible inflation values into some distribution of present inflation values. Typically, the neo-Fisher argument uses rational expectations and so only cares about the mean, but this misses something critical.

Let's say the distribution of future inflation is a normal distribution with some mean and variance. Because of the central limit theorem, the sum of a large number of random variables drawn from any distribution with the same mean and variance will result in a normal distribution. That is to say there are a lot of different present distributions from which the cumulative inflation time series path (think Brownian motion path) could be drawn that is consistent with a future normal distribution.

Here'a picture where the original distribution is normal and one where it is uniform -- both can lead to a normal distribution (the normal distribution is the defining member of a universality class of distributions with a given mean and variance):

The central limit theorem in picture form.

Now what does that backward time translation (i.e. expectations) operator do? Well, it should translate the information in the future normal distribution into the present distribution -- but there are an infinite number of different present distributions consistent with a future normal distribution. How do you choose? You can't. In a sense, the neo-Fisher solution requires you to un-mix the cream and the coffee!

Source.

It makes sense if you just look at the mean. Since the future distribution mean depends only on the present distribution mean (the law of large numbers), the present distributions all have the same defining property (i.e. a given mean). However, the real PDFs can be very different -- and you can't see the information loss problem if you ignore them.

Basically, the neo-Fisher result is just a demonstration of the existence of a path that leads to a scenario where interest rates go up and inflation goes up. However, as expectations change in the short run, and the different random walks corresponding to the different present distributions are the most different in the short run, it becomes highly unlikely that the actual path the economy follows will be the neo-Fisher path.

...

Update 15 April 2016

I thought I'd add this picture of the central limit theorem in action from Wikipedia instead of just linking to it:


Matthew Yglesias is still withholding the economic theory of everything

If I was having a drink with Matthew Yglesias in a bar and talking about the 1990s, I probably wouldn't have a problem with what he says in this article. I would assume he was expressing his opinions and that it's genuinely hard to tell exactly what impact macroeconomic policies actually have. But instead, it's being expressed as a Vox explainer purporting to represent some kind of objectivity.

What this article needs is a disclaimer "some economists believe, but there is little evidence for" in front of almost every statement of macroeconomic "fact". Yglesias is biased not just towards a monetarist view (after being converted by Scott Sumner several years ago -- since at least  here), but in fact that he himself knows how macroeconomics works. In fact, Yglesias has teased us with results from his secret macroeconomic theory of everything before.

In addition to those disclaimers, there are actually countervailing theories and evidence against this statement presented as a fact:
Recessions happened in the back half of the 20th century because the Federal Reserve raised interest rates to slow investment and the economy to keep inflation in check. In the 1950s and '60s this had worked well, but over the course of the 1970s inflation got out of control even as unemployment stayed stubbornly high.
For one, I thought there existed a view that the Fed of the 1950s through the 1970s didn't focus on inflation and was deliberately trying to lower unemployment as much as possible.

For two, I didn't know economists had figured out what recessions are yet. In a possible interpretation of the information equilibrium model, raising interest rates might cause the economic overshooting that results in a recession. But in general, we don't know what recession are, despite many economists' frameworks being essentially definitions of what a recession is. So I guess Yglesias is in good company there.

But the thing is that there is no real evidence of any kind of policy changes in interest rates or any kind of diversion of core PCE inflation from what are effectively log-linearly/linearly increasing functions:


There was a spike in inflation that coincides the energy crisis of 1973, but mostly we have a steady increase in inflation and interest rates that belies anything "worked well" in the 1950s or 1960s and then became "out of control" "over the course of the 1970s". And note the core CPI data isn't good enough to draw any kind of conclusion.

My view from the information equilibrium (IE) model is that the inflation and interest rate drift were inevitable consequences of a growing economy starting from a small monetary base. Additionally, the IE model could have predicted in the 1950s interest rates would continue to increase -- more evidence that policy didn't necessarily have an impact.

Although this specific model is definitely an alternative view, the idea that Fed policy had some kind of impact from the 1950s through the 1970s should be viewed with skepticism because of the lack of any particular signal in the data.

Wednesday, April 13, 2016

More on the Great Depression

David Glasner has a new post up on the monetary theory of the Great Depression which reminded me that I could do a bit more in the vein of this post. I'm sure the data is probably consistent with several different causal mechanisms. My only (interesting) opinion about the gold standard was that leaving the gold standard wasn't relevant to the recovery, but rather interest rate pegging driving (effective) hyperinflation.

Anyway, I grabbed the FRED series A08170USA175NNBR (non-agricultural employment 1900-1943) and tested the model that nominal shocks were proportional to labor supply shocks (that I talked about in this post)


In fact, the GNP data go back far enough to look at 1921-1942. So here's the extended inflation graph:


Here's the extended nominal shock graph (with the employment shock model, which works really well):


And here is the interest rate model (from the paper) using the 3-month secondary market rate (solid) as well as data form measuringworth.com (dotted):


Unfortunately due to the low resolution of the data, I can't quite see if this mechanism is at play -- that the Fed raised interest rates (see here also) and caused an "avalanche". Raising interest rates (effective monetary tightening) in the run-up to the market crash of 1929 caused the subsequent crash (similar to the effective rise in interest rates in the run-up to the Great Recession), like an airplane stalling to lose altitude.

Here's a graph of that more recent effective rise in interest rates:


And the tightening by the Fed started happening as early as the 1920s, much like the Fed tightening starting in the mid-2000s.

...

Update 14 April 2016

I finally found a source for this this older data and was able to make some better graphs (instead of a cheesy overlay) in both log and linear scales:


...

PS [old charts from 13 April 2016]

I did find some data from here that I've overlaid on the interest rate model graph above:

And here's a zoom in on the relevant piece:


What is interesting to me is the piece where the interest rate exactly follows the rising segment of the model output from about 1925 to 1929. That's very similar to the result for the years before the Great Recession, albeit at a much steeper rate:


I'm still looking into this, but the avalanche model where the Fed piles snow on the mountain by tightening policy, creating a bubble and raising GDP above its "natural" rate is looking pretty good.