As part of the celebration of this blog's third birthday, I thought I'd close out a set of predictions I made two years ago.
Updated previously under the heading of "not bad for five parameters" and doing well at the 18-month mark (where you can go if you want to see more details), I get to finally declare victory. One annoying part was that because I used a different convention for labeling data (most of the time I say a quarterly measurement comes at the end of the quarter, but in this prediction I used the beginning of the quarter) it required me to wait until Q1 2016 data was available in order to make it to the forecast endpoint of 2016. Anyway, this morning around 8am EDT the BEA released that data point (it was 1.2% NGDP growth).
The big unforeseen event was the Fed raising its interest rate target in December of 2015. I had tacitly assumed that because the model predicted below-target inflation and moderate real growth that there'd likely be no reason for a Fed rate hike. I guess I got that wrong. But then that meant the assumed path of the economy (for the prediction) diverged from the path it actually took -- and I'm still looking into the impact of the rate hike. If doing this again, I'd also use the average value form (the model represents the average value, shown in the link in the previous sentence) instead of the upper bound form (the model represents the upper bound, which I used for the interest rates). Again, if you want to see more details about the predictions, head over to the to the 18-month update.
One important thing to note is that the interest rate model has two parameters in total. That is to say
{r3m, r10y} = f(NGDP, M0, MB, a, b)
Overall, however, the predictions were successful, so I'll declare this one a success on the prediction page.
Here are the graphs (I added 2-sigma errors to the CPI and RGDP graphs):
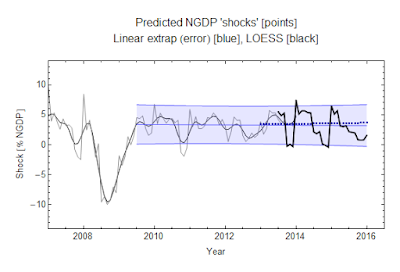
Here are the "nominal shocks" both with mean prediction error (the error in predicting the mean, the smaller error bar) and single prediction error (the error in predicting a single value, the larger error bar):
Here are the assumed (counterfactual) paths that led to the predictions (the monetary base was lower than the assumed path):


Woo hoo! Time to celebrate. Blueberry cup-cakes for everyone?? ;)
ReplyDelete