
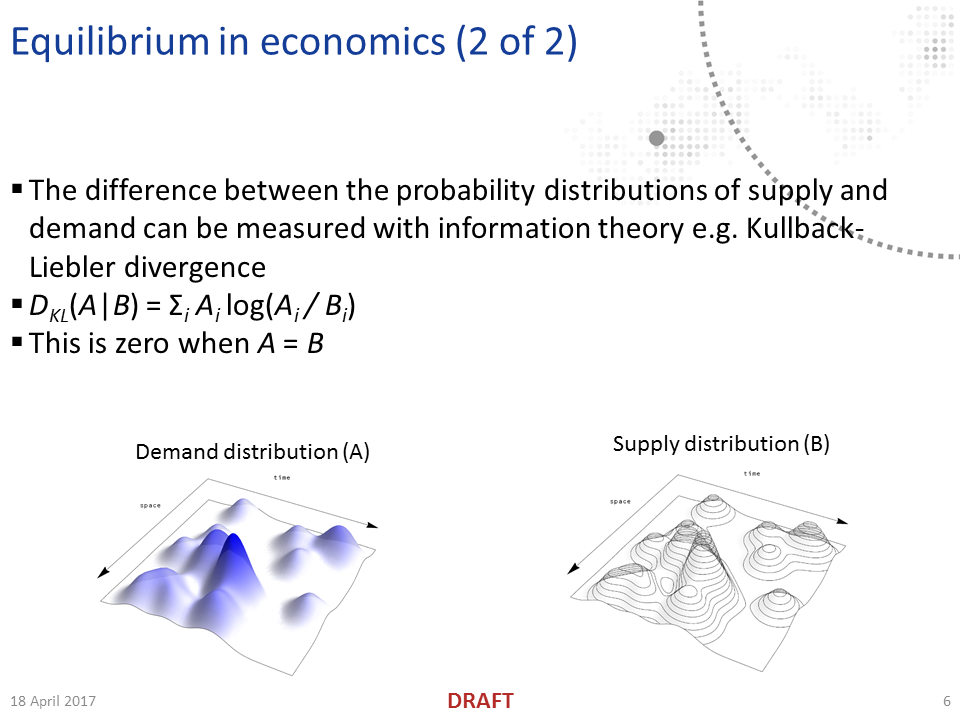
I posted an org chart of information equilibrium concepts yesterday; today I created a presentation that takes you on a tour of the whole thing. It represents a 50-chart summary of most of the work on this blog.
You can download the chart package [pdf] or powerpoint [ppt] (let me know if my Google Drive settings aren't working for you in comments or via tweet), or you can just look at the images below the fold.


No comments:
Post a Comment
Comments are welcome. Please see the Moderation and comment policy.
Also, try to avoid the use of dollar signs as they interfere with my setup of mathjax. I left it set up that way because I think this is funny for an economics blog. You can use € or £ instead.
Note: Only a member of this blog may post a comment.