Friday, October 31, 2014

The trouble with Nick Rowe's expectations without concrete steps

I've been thinking about how expectations can set macroeconomic variables without "concrete steps", and in particular Nick Rowe's analogy with daylight savings time. I had some brief interaction with Nick in comments on my post here and this can be seen as an counterargument to this post by Nick.

Nick puts forward two analogies where we achieve a real macro outcome but we don't know what the concrete steps are (or there aren't any concrete steps): driving on the right and daylight savings time. In these situations, the government sets an expectation and everyone complies because everyone thinks everyone else will comply (in this model). This motivates the same logic applying for NGDP (and elsewhere inflation) targeting.

The trouble I've been having with this argument comes down to the fact that we as individuals choose which side of the road to drive on or to set our clocks back. Individuals have the power to set their clocks to any time or drive on either side of the road, and individuals enact the concrete steps. Individuals can't turn a wheel or push a button to set inflation or NGDP.

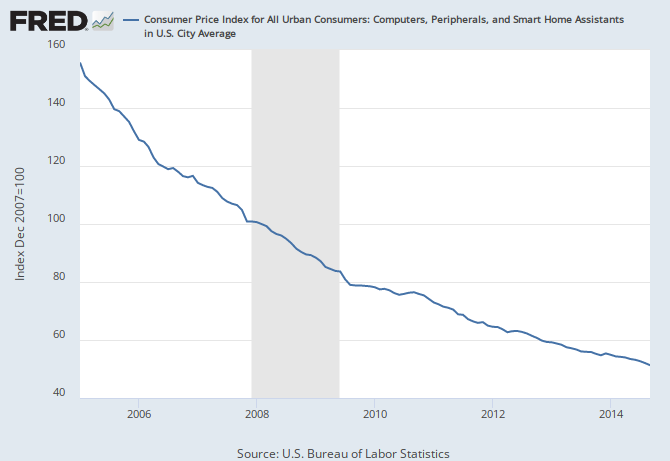
If the central bank set an inflation target and everyone decided to set their prices to rise at 2% per year, then the above analogies seem appropriate. In some cases that could be true: cost of living adjustments, long term contracts, investment decisions, buying a house, etc. However, we as individuals (or even firms) don't make all the choices involved in setting inflation. Some goods actually decrease in price (here is the CPI for computers):


This would be akin to whole segments of the population setting their clocks back when everyone else sets them forward. Additionally, "hedonic" and "quality" adjustments adjustments are made to CPI [1]. The owner of a restaurant can't decide to have prices rise at 3% while having people enjoy the food 1% more. No one can make technology improve based on expectations alone (or can they?).

Unlike daylight savings time or driving on the right, the concrete steps required to enact the inflation or NGDP expectations set by central bank are out of the individual's hands. This is why I reside on the concrete steppes and believe that physical currency ("M0") sets inflation [2], with a changing, but concrete [3], definition of the unit of account.

Footnotes:

[1] PCE inflation measures are highly correlated with CPI and chained CPI, so it would be remarkable if they represented completely independent processes. Without loss of generality, let's stick to CPI inflation.

[2] Empirically, not ideologically -- if it was M1, MB, MZM or any other definition of money, that would be fine by me.

[3] It's very concrete -- the factor is given by the information transfer index and is explicitly κ = (log M0/c) / (log NGDP/c).

Thursday, October 23, 2014

Psychohistory? (Qu'est-ce que c'est)

I was reminded of Asimov's psychohistory after reading Igor Carron's post on a new book on signal processing. There were two main axioms (from Wikipedia):
  • that the population whose behaviour was modeled should be sufficiently large
  • that the population should remain in ignorance of the results of the application of psychohistorical analyses
The theory seems to axiomatically depend on expectations (in economics terms). Knowing the results, in Asimov's galaxy, can influence the outcomes -- hence the rationale for keeping the population in the dark. The information transfer framework mostly depends on the first axiom to produce models, and should produce the same results even if people know about the results of the models -- could it be considered a generalization of psychohistory?

However, Asimov seemed to believe correlations caused things to happen ('mass action'); in the information transfer framework, correlations cause things to fall apart.

Supply and demand for non-ideal information transfer (and other stuff)

Sorry about the lack of posts lately -- I've been busy with with work and on travel. I also discussed actual research money for the model through a (somewhat non-traditional for economics) funding agency and put the idea in front of two professional economists. Understandably, skepticism all around (I have an upcoming post on one of those interactions).

I am also working on a post that started out as a start towards fully incorporating the idea of expectations (as a source of information loss) in response to a piece by Nick Rowe, but Nick has another interesting one that I haven't fully digested yet. Still writing there.

So here's a quick post. Awhile back I did a post on the minimum wage; I used a least informative prior with the non-ideal information transfer to say that the observed price is somewhere in the lower triangle of a supply and demand diagram (see link at the beginning of this sentence for details) -- I don't know where. If we take each position in that lower triangle to be equally probable, then you can show that the centroid appears below the ideal price but at the same quantity supplied/demanded as the ideal equilibrium.

What happens to this point under shifts of the supply and demand curves? Well, it turns out, the non-ideal price follows along a non-ideal supply (or demand) curve that is parallel to the ideal curve. Here's a graph; the purple points represent the starting point and the point after the shift while the dashed purple curve represents the locus of points for different shifts:


Tuesday, October 14, 2014

Did the Fed cause the Great Recession in the Eurozone?

Scott Sumner's post on Euro-denial among the econ reminded me that I hadn't yet updated the Eurozone trend to account for the strange (and likely not relevant to inflation) impact of 500 € notes. Needless to say, I remain an ECB apologist. It still looks like the big shock of the recession was a result of being above trend:


The secondary shock in 2011 still looks like it came from being above trend as part of a rebound from the lows of 2010. If there is a shock happening now it may well result from external factors like Russia/Ukraine since the data appear fairly close to the trend line.

There was something interesting I saw, however. In this post, I showed that the deviation from the trend in the US in the lead-up to the Great Recession was due to monetary policy by plotting the monetary base on this same graph as M0 (currency). The dotted monetary base line appears to push the M0 curve above the trend and then falls away after the recession (graph reproduced from the linked post):


The monetary base controls the short term interest rates. When the two curves (M0 and MB) approach each other, yield curve inversion becomes more likely, which tends to be a precursor to a recession. The existence of minimum central bank reserves tends to keep the M0 line a constant distance to the left of the MB line. We can see the Fed raising short term interest rates in the mid-2000s and then rapidly lowering them as the Great Recession hits. However, after that, the MB line is so far from the M0 line, it has little to no effect on NGDP (a liquidity trap).

What does this curve look like for the ECB?


It looks like the monetary base has been too large since the inception of the Euro to have any impact on the NGDP-M0 path of the Eurozone economy. It is possible "tight money" (i.e. slow MB growth) pushed the M0 path above the trend in 2010-2011, like a miniature version of the US in 2008. Overall, though, it looks as if short term interest rates (monetary policy) haven't had any traction since 2002. Even with the base expansion, the ECB has mostly been spinning its wheels -- it's been in a liquidity trap this whole time.

Sumner puts the expert witness [3] on the stand:
But the ECB wasn’t even close to the zero bound in 2008.  I get that people don’t like NGDP growth as an indicator of monetary policy, and want “concrete steppes.”  Well the ECB raised rates in 2008. The ECB is standing over the body with a revolver in its hand. ... And then three years later they do it again.  Rates were already above the zero bound in early 2011, and then the ECB raised them again. Twice.  The ECB is now a serial killer.
The liquidity trap has little to do with the zero lower bound (although there is a sense in which they tend to occur together). Interest rates were already too low to move the economy in 2008 and continued to be low through 2011 (the MB curve was well to the right of the M0 curve).

The Eurozone has been like a rudderless ship since the Euro started -- it just so happens that the Great Recession is the only major shock they'd ever had to deal with and the fact that they can't do anything about it makes them look hapless. [1]

But that leaves a question: if the ECB didn't cause the path to rise above the trend (like in the US case), what did? Did the Eurozone import a financial boom from the US? Did the Fed cause the Euro crisis as well as the US recession? Was the ECB framed? [2]

Hmm...

[1] As an aside, I wonder if this explains the strange movements of the Euro monetary base during the Great Recession -- it's like the rudder inputs from a pilot who doesn't know he has lost the rudder, moving side to side, erratically.

[2] I thought about using the title "Has the Eurozone always been in the liquidity trap?" with a nod to The Shining, but Sumner's murder mystery was too much fun.

[3] The economists in denial, per Sumner's accusation.

Monday, October 13, 2014

Coordination costs money, causes recessions

Let me put forward a thesis of what causes recessions: coordination.

This is, in a sense, the converse of what David Glasner refers to in his recent and several of his prior posts. Glasner advocates a theory of coordination failure to explain what recessions are, how unemployment can rise above full employment and why wages are "sticky". I will get back to Glasner towards the end of this post.

I started to put together an initial version of my thesis in part III of this post; here I plan to further develop it with a toy model (although there is no real loss of generality here -- it just helps to be explicit).

In my response to one of Glasner's prior posts, I put forward the idea that wage stickiness is an entropic force. Coordinated changes to the distribution of wages costs "entropy", and this cost is experienced in the macroeconomy as the resistance of the wage distribution to change ("stickiness"). Let me return to the wage distribution in that post; we had four cases:


Starting from the top left and going clockwise we have (1) the original distribution(roughly coinciding with the theoretical curve in blue) , (2) the distribution re-arranged to over-represent nominal wage cuts (the vertical line represents zero growth), (3) the distribution re-arranged to over-represent zero nominal wage growth (as observed in data from the SF Fed), and finally (4) a distribution with 10% of the distribution thrown out of the labor force (i.e. unemployment).

Of course, dealing with a continuous normal distribution is hard, so I decided to take these scenarios on as uniform distributions:


The other benefit to using a uniform distribution is that we can directly relate it to the economic combinatorial problem where the number of states goes as $NGDP!$ (that's a factorial, not shouting NGDP) and "economic entropy" $S_{e}$ is:

$$
\text{(0) }S_{e} (NGDP) \simeq k_{e} \log \left( \frac{NGDP}{c_{0}}!\right)
$$

Let's call $(NGDP/c_{0})! \equiv n$ the number of states in the economy. The other key ingredient we need to use is the fact that total nominal wages (NW) are directly proportional to NGDP -- this allows us to make identical arguments and switch back and forth between NGDP and nominal wages. Now scenario 4 directly reduces NW -- we've thrown 10% (let's call that $m$) of the labor force out of the economy -- and is associated with a fall in $S_{e}$:

$$
\text{(1) }\Delta S_{e}(n, m)/ k_{e} =  \log (n - m) -  \log n = \log (1-m/n)
$$

It is not necessarily immediately obvious that the other changes are also associated with changes in $\Delta S_{e}$, but it turns out they are. In scenario 2, if we take the probability that a state is one of the over-represented states to be $p$ and the under-represented states to be $1 - p$, then going back to the definition of entropy in terms of the probability of states (which coincides with the Shannon entropy in information theory I touched on once before in this post), we can work out the change in entropy to be:

$$
\text{(2) }\Delta S_{e}(n, m, p)/ k_{e} =  p \log \frac{m}{p} +(1 - p) \log \frac{n - m}{1 - p} - \log n
$$

If we take $m = 0.1 n$ and $p = 0.3$, then  equation (1) gives us -0.105 and equation (2) gives us -0.154. If $p = 0.262$, then the entropy loss is the same for scenarios 2 and 4 (i.e. -0.105). That is to say that an over-representation of 10% of the wage growth (or here, wage cut) states by a bit more than a factor of 2 (e.g. doubling the number of people who take wage cuts relative to normal times) is an equivalent entropy loss to removing that 10% from the labor force.

We can also use equation (2) to give us an estimate of the entropy loss from "sticky wages" in scenario 3 -- zero nominal wage growth for some fraction of the population. In that case $m = 1$ (a single state, zero growth, is over-represented). If we have a lot of states and $n \gg 1$, we can approximate

$$
\text{(3) }\Delta S_{e}(n, p)/ k_{e} \simeq  - H(p) - p \log n \simeq - p \log n
$$

where $H$ is the binary entropy function with information measured in nats. The entropy loss in scenario 3 is approximately the fraction of entropy given by the probability of an individual in the labor force finding himself or herself in the zero nominal wage growth state. In the data from the SF Fed, 16% of individuals are in that state, so that would represent a loss of 16% of "entropy" ... assuming the initial distribution was uniform. Now it isn't a uniform distribution and what really matters is the change in the distribution relative to the distribution in normal times. Most people usually go for a long period of time -- maybe a year or so -- at the same wage/salary after they get a raise, for example. That would mean the zero growth state is probably over-represented in normal times regardless of the distribution, and we would be referring to over-representation above and beyond that level.

The key take-away, however, is that all three scenarios represent a loss of entropy. And for small changes in NGDP, we can use Stirling's approximation in equation (0) to show:

$$
\Delta S_{e} \simeq \frac{k_{e}}{c_{0}}\Delta NGDP
$$

Entropy loss is NGDP loss -- an economic shock. In each of the scenarios 2 and 3, the resulting distribution is more coordinated relative to the normal state in scenario 1. The uniform distribution (or Gaussian/normal distribution) represent minimally informative (maximum ignorance) distributions; another way, there is knowledge gained (ignorance lost) in the distributions of scenarios 2 and 3. Something is coordinating market outcomes to produce a distribution that otherwise would not exist. That something is human behavior.

A recession is a temporary human coordination of the market [2] (through some sort of market panic or possibly guided by an economic authority like the central bank) that results in a loss of NGDP. This is how we can have all the same stuff before and after a recession strikes, but somehow it's all worth a bit less in the aftermath. The temporary coordination results in a bit of scenario 4 (the economy shedding jobs) and scenario 3 (zero nominal wage growth/sticky wages).

Why not scenario 2 (nominal wage cuts)? This is the problem that Keynes tried to deal with via sticky wages and the liquidity trap and to suggest that it wouldn't happen was so implausible to neoclassical economics that they assumed it away. This is Glasner's coordination failure -- if we (or the market) implemented scenario 2 instead of scenario 4 (unemployment), we could keep everyone employed.

My guess is that scenarios 3 and 4 represent channels that are much more efficient than scenario 2. In order to achieve the same entropy loss as scenario 4, scenario 2 has to over-represent 10% of the wage states by more than a factor of 2 -- that means that on the order of 30% of the labor force has to get nominal wage cuts (rather than 10% of the labor force getting pink slips). Likewise, 10% of the labor force having zero wage growth can accommodate a shock of 5% of NGDP (using NGDP ~ 2.1 NW). Using scenarios 3 and 4 together can have more impact than scenario 2 and involve fewer people. This suggests the market could be using its own principle of least effort.

Interestingly, attempting to implement the nominal wage cut coordination it after the recession hits would involve adding NGDP comparable to the loss in NGDP from the sticky wages/unemployment coordination -- immediately bringing to mind fiscal stimulus sufficient to close the output gap as advocated by Keynesians.

Whether the coordination happens spontaneously due to announcements from the Fed or financial panics or is encouraged through government spending or monetary stimulus, it costs money in both senses of the word -- you lose money if coordination happens and you have to pay in order to get coordination.

Footnotes:

[1] Also note that for a system with constant volume and temperature, a change in entropy is a change in "free energy" -- a reduction in entropy consumes free energy, whereas an increase in entropy gives off free energy (this is how e.g. life typically works).

[2] Basically, because the market is made of people, we can violate the second law of thermodynamics (ΔS > 0) by coordinating ourselves in a way that atoms or particles can't. There is no second law of econo-dynamics because of human behavior -- which is unfortunate because otherwise (if human nature didn't matter) ΔS > 0 would imply ΔNGDP > 0 -- the economy would always grow (absent real shocks like natural disasters or resources running out).
Sunday, October 12, 2014

Can China successfully slow down?


I was asked a couple months ago whether China's growth was sustainable, and the answer was basically yes over the next several years:

http://informationtransfereconomics.blogspot.com/2014/08/the-economic-future-of-china-is-so.html

The data is very noisy, but a long run average of 8% RGDP growth seemed to fit the general trend.

This is also consistent with China's official target of 7.5% (at least given the noisy data). I learned that fact alongside the fact that China is deliberately trying to slow growth from this article by Ken Rogoff:

http://www.project-syndicate.org/commentary/questioning-chinese-economic-climate-by-kenneth-rogoff-2014-10

Rogoff says that Greenspan was able to accomplish this, but in the information transfer model, the economy was basically on a falling inflation path all along. Kind of like giving someone credit for the sun rising in the morning. (Does that mean Greenspan was basically like the god-kings of old, given credit for good harvests and the flooding of the Nile?)

Can China push itself off of the NGDP-M0 path (in the graph above)? I don't know, but it will be interesting to find out.

[I'm on travel, so sorry about the bad formatting and lack of graphs -- I'll fix it at some point. ... Fixed some of it 10/13/2014]

Saturday, October 11, 2014

Entropy, in three pieces

Entropy. Picture from askamathematician.com.

I. 

Noah Smith thinks that the Efficient Markets Hypothesis has something to do with information theory:
This is because the EMH doesn't emerge from any peculiarity of the way our market system is set up, or the way human beings behave. The EMH comes from something much deeper than that, something that probably has to do with information theory. It comes from the fact that when you exploit information to make a profit in a financial market, you decrease the amount that others can exploit that information. In other words, the financial value of information gets used up [emphasis in original].

One way to see biology is as a process by which living things intercept entropy (free energy) flows. An autotroph converts low entropy high energy photons into high entropy waste (heat, low energy photons); a heterotroph converts low entropy organisms into high entropy waste (heat, poop). Economic agents intercept entropy (information) flows: they convert low entropy money into high entropy goods and services. 
In living things, the free energy in the photons or sugars is converted into lower free energy products and the information in their original structure is lost. The information in the market (e.g. prices of goods) is converted in to quantities of goods where the prices they were bought at no longer matter (according to the EMH). This information is consumed by the market in the same way free energy is consumed by organisms [emphasis mine].
Actually, the main thrust of this blog is that supply and demand are a manifestation of information theory, and market forces are entropic forces. The EMH itself is the analog of the fundamental postulate of statistical mechanics.

II. 

Mark Buchanan defends his view that energy consumption rises with GDP, contra Paul Krugman who says it doesn't have to. Buchanan says that his view was that energy rising with GDP was not an inevitable law of nature, but rather pessimism about our ability to conserve energy (with which I agree). But Buchanan does seem to want to hold on to his point by citing a paper which shows that power use per capita is related via a power law to real GDP per capita. The paper makes the claim that it may not be a coincidence that the power law has an exponent of 0.76, close to the 3/4 power law relationship between mass and energy consumption for organisms. I have two issues with this. One, the units seem all wrong. the relationship for economies is in Watts per capita while GDP is in year-2000 dollars per capita per year -- GDP is not "mass" but rather a growth rate (mass would seem more likely proportional to the value of all goods and services in existence ... the computer I'm using right now still consumes a few hundred Watts of power, but no longer contributes to GDP as I already purchased it). Two, the financial sector is now 10% of US GDP but is a tiny fraction of total US power consumption while the transportation sector is about the same fraction of GDP but uses a large portion of the total energy.

I also think the calculation E ~ GDP is all wrong in general (the economy is not an engine), and showed in this post (in a footnote) that the fundamental physical (computational) limits of the economy as an information processing system required only about 1 red visible light photon per day to produce the entropy change going from 2013 to 2014. Here's more:
Based on this measure (comment) of the number of states in the economic system in the US the amount of energy that would need to be supplied to change the entropy of the US economy from 2013 to 2014 (at 290 K) comes out to be about 6 x 10^-17 Joules or about 400 eV, or about the energy equivalent of 1 red photon per day. 
Now our conversion factor from information to energy is not as good as Nature's kB = 1.38 x 10^-23 J/K -- in fact, given the US energy consumption of ~100 quadrillion BTUs, I'd estimate [the economic Boltzmann constant at] kE ~ 2.5 x 10^13 J/K, or off by a factor of 10^36 from the fundamental limit (kB). That leaves a lot of room for improvement! 
Now if kE doesn't change, you could make an argument that limits to energy consumption (and conservation) are limits to growth [that go as GDP log GDP]. However, in 1960, kE ~ 100 x 10^13, or about a factor of 40 higher (based on ~ 50 quadrillion BTU energy consumption). Assuming we could get another factor of 40, the nominal economy could grow by about 2.5 times and use the same amount of energy.
The survival of biological organisms depends on the consumption of free energy, which is a change in entropy (at constant temperature and pressure), not mechanical power (as is measured by the energy consumption statistics). It is also worth noting that dollars are units we as humans invented. They lack the fundamental heft of "mass" or "energy" (analogs of which would like exist on alien worlds). There is no reason why there should be a decades-long stable relationship between dollars and energy.

III.

David Glasner has another great post on coordination failures and "sticky prices" where he gives two sticky prices (the real wage and the real rate of interest) and two separate human-behavior mechanisms for why they do not fall far enough during a recession (no one worker accepting a lower wage can ameliorate the fact that wages are too high and entrepreneurial pessimism, respectively).

These mechanisms are only unified in the sense that they are coordination failures -- they involve completely different sets of human behaviors and expectations. They also strike me as just-so stories. Reading through Glasner's discussion, you ask yourself questions. If an employer only had a few employees, wouldn't the effect of the reduction in one employee's wages on the business's bottom line be comparable to the few percent slowdown that happens during a recession? If faced with a choice between a layoff or a wage cut, I think I would take the wage cut (I happen to like my job). Employers say they don't cut wages because it hurts morale. However, employers frequently reduce hours -- wouldn't that reduce morale as well? Why more in one case, but not the other? Also, wouldn't some entrepreneurial optimist clean up during a recession with all that free money?

That's why I'm glad Glasner doesn't put too much stock in the specific explanations, but instead says:
It is not obvious what sequence of transactions would result in an increase in output and employment when the real wage is above the equilibrium level. There are complex feedback effects from a change, so that the net effect of making those changes in a piecemeal fashion is unpredictable, even though there is a possible full-employment equilibrium ...
 ... [the explanations leave out] coordination problems that might arise in a multi-product, multi-factor, intertemporal model in which total output depends in a meaningful way on the meshing of the interdependent plans, independently formulated by decentralized decision-makers, contingent on possibly inconsistent expectations of the future.
I think at the heart of these coordination problems lies entropy. Sticky wages or prices are the result of an entropic force -- a (minimally informative, i.e. equilibrium) distribution of wages does not spontaneously arrange (coordinate) itself so that everyone is still employed at the new (lower) wage. Instead you likely get a break-down of the information transfer system of the market (I once looked at the possibility that the information received by the supply was less than the information source information in the demand and that the difference was about the same across employment and interest rate markets).

But one difference between my view and Glasner's is that there really isn't any coordination in the first place. People's plans are randomly sufficiently consistent (or not seriously inconsistent) with each other to keep the economy going most of the time -- the economy is in a random configuration that is consistent with NGDP. The problem seems to be that, occasionally, humans coordinate themselves (mass panic) and the coordination required to undo the damage done by that spontaneous coordination does not happen spontaneously (much like entropy doesn't spontaneously decrease). For example, Vulcans might not have recessions in their economy (were it to have money) because the coordination in the initial mass panic (or just mass pessimism) that triggers layoffs and the fall in NGDP would not occur. No coordination required to undo the (non-existent) damage.

You can imagine a mass panic due to someone yelling fire in a movie theater; the coordination required to undo the spontaneous coordination that happens when someone yells "fire" does not happen spontaneously. Sometimes humans can spontaneously coordinate to increase economic output -- unfortunately the examples seem to be wars and market bubbles.

If you yell "fire" at a bunch of methane molecules in air, they don't spontaneously change their velocity to avoid combustion. But if they did, that would be a spontaneous decrease in entropy as well as lower the free energy of the gas -- meaning the new equilibrium energy is lower. You can't get that free energy back unless you coordinate the methane molecules to return to their original distribution (you might have to coordinate some of the molecules in the air as well) -- which would cost about as much free energy as the original loss [1].

In economic terms, the spontaneous coordination in a recession costs GDP (economic entropy is a function of GDP) that doesn't come back without government coordination (monetary and/or fiscal) or a long wait for GDP growth.

Footnotes:

[1] I'm thinking there's a good analogy with fiscal stimulus and the output gap here.

Tuesday, October 7, 2014

There is no limit to how many things humans can tell each other to do

I wrote a comment on Paul Krugman's post from earlier today that starts out:
As a physicist, I've never quite understood the "limits to growth" arguments -- I believe the major mistake my brethren are making is thinking of an economic system as an engine (fuel goes in, goods and services come out) rather than as a computational/information processing system.
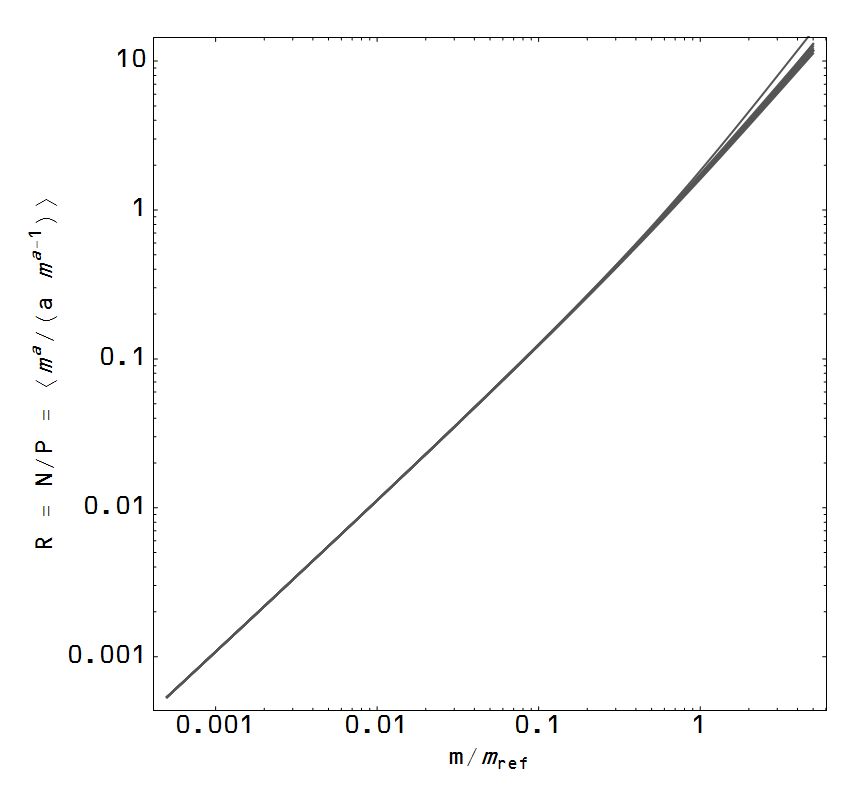
I'd like to flesh this out a bit. For all the posts on secular stagnation (demand side version)/Great Stagnation (supply side version) -- a good place to start is here -- I have no strong beliefs about how much stuff can be moved around by money (paraphrasing Simon Amstell's definition of money). The bending of the curves of the price level P and nominal GDP versus the currency base are all nominal things. That is to say, they are all defined in terms of a unit of money we invented. It is unlikely that physics places some fundamental limits on some definition we wrote down [1]. "Real" GDP is supposedly the actual measure of economic activity, but that depends on the particular relationship between NGDP and P, but still depends on the information processing system of the market (it's measured in e.g. 2010 dollars -- units we also invented). For example, here are some simulations of a thousand random markets and the expected values of the price level P, NGDP = N and RGDP = R:


Economic growth is not more/bigger stuff (we basically have the same amount of stuff on Earth as we did before money happened), but more information being processed.

An interesting way of thinking about this is that although e.g. a writer typing a paragraph on a laptop is doing approximately the same amount of "real work" as he or she did 20 years ago, the number of instructions per second the laptop processes during the time it takes to write a paragraph has increased exponentially. That increase has almost nothing to do with the "real work" done by the writing, and the market is essentially that software churning in the background. There is really no limit to the number of instructions that can be processed in the course of writing a paragraph. [Ok, there are limits, but they are not meaningful limits.]

Another way of putting it is that saying there are limits to economic growth based on fundamental laws of physics (or whatever) is like saying there are limits to how many tasks humans can tell other humans what to do.

Money, and therefore the economy, is just a way for everyone of us to tell people to do stuff.

[1] If the economy is an entropy production process, then there are limits to how much stuff can be moved around by money, but they are not particularly relevant limits. Most of the entropy production on earth is in the water cycle. A tiny fraction of the planet's entropy production is done by all of life on Earth. We are nowhere near this and won't be for a long, long time -- and at that point we can start taking over the water cycle's job and have a few more eons before we start to run into problems. I'll do the order of magnitude calculation and post it here in an update.

This is just a fancy way of saying energy consumption is not the relevant factor, but rather free energy consumption (available entropy).

UPDATE 10/8/2014: The calculation ...

Based on this measure (comment) of the number of states in the economic system in the US the amount of energy that would need to be supplied to change the entropy of the US economy from 2013 to 2014 (at 290 K) comes out to be about 6 x 10^-17 Joules or about 400 eV, or about the energy equivalent of 1 red photon per day.

Now our conversion factor from information to energy is not as good as Nature's kB = 1.38 x 10^-23 J/K -- in fact, given the US energy consumption of ~100 quadrillion BTUs, I'd estimate kE ~ 2.5 x 10^13 J/K, or off by a factor of 10^36 from the fundamental limit (kB). That leaves a lot of room for improvement!

Now if kE doesn't change, you could make an argument that limits to energy consumption (and conservation) are limits to growth. However, in 1960, kE ~ 100 x 10^13, or about a factor of 40 higher (based on ~ 50 quadrillion BTU energy consumption). Assuming we could get another factor of 40, the nominal economy could grow by about 2.5 times and use the same amount of energy.

Under the spell of the expectations fairy

Scott Sumner leaves my people of the concrete steppes with an ultimatum -- choose one of the following:
1.  Concrete steps are what matters, not expectations fairies.
2.  Huge helicopter drops will always create inflation.
But only after he's surrounded our village with his model of how economies work.
"And we know [the statement 'dropping a trillion dollars out of a helicopter will create inflation'] is wrong because Japan did drop a trillion dollars out of a helicopter and it didn’t work.  They did an almost unbelievably large money-financed fiscal expansion over the past 20 years, and got DEFLATION ... Japan has increased its national debt to over 240% of GDP, and even about 140% in net terms (still among the largest in the developed world.)  And while doing so they increased their monetary base enormously."
The monetary base (MB) has nothing to do with inflation. There is literally no way the Japanese MB could have a consistent relationship wil the Japanese price level. The key variable in inflation is the monetary base minus central bank reserves (i.e. currency in circulation "M0") which has been relatively flat since 2000. You can see that M0 is a pretty good model of the price level in Japan:


And we even get the deflation right. That comes from the fact that adding some Yen to the economy increases the medium of exchange, allowing for more information-bearing transactions to take place, but also redefines the unit of account [1] so each Yen carries less information. These two effects compete so that when log M0 is small relative to log NGDP, the medium of exchange increase dominates, but when log M0 is large relative to log NGDP, the shrinking unit of information becomes the main effect (resulting in deflation).

So what is the monetary base good for? Short term interest rates. So Sumner says something that is rather trivial in the information transfer model:
"The BOJ (wrongly) feared inflation, and thus began raising rates. With higher interest rates the bloated monetary base could cause high inflation. So at the same time the BOJ reduced the monetary base by 20%."


The base and short term interest rates are intimately linked -- raising rates is equivalent to reducing the monetary base under liquidity trap conditions. Now the short term interest rate market has wild fluctuations (it's a pretty good indicator of a recession [2] when it is well above the trend value set by the monetary base, like in 2008), but across several countries, we can use MB to make a pretty good model of the short term interest rates and M0 for the long term ones -- the 3 month libor rate (blue) and the 10 year BoJ treasury (red), respectively as shown in the graph:


So in the case of Japan, we have no true Scotsman helicopter drops (printing currency to buy goods and services, not expanding reserves) so neither statements 1 nor 2 above apply to Japan.

The thing is, Japan pretty much disproves monetarism in general. There is no consistent relationship between measures of money and inflation (or the price level) that does not involve a changing definition of what you mean by 1 Yen. The market monetarism fix is to basically say that the changing definition problem is solved by "expectations". For Japan, that means the market expects Japan will suddenly cut not only the monetary base, but actual currency in circulation by 80% sometime in the near future (the price level has been roughly the same since the 1990s while the monetary base has more than doubled). This is, in a word, dumb. 

However the information transfer model solves this changing definition problem in a different way. It says that each Yen has effectively lost 80% of its information carrying capacity since the 1990s, so adding Yen doesn't raise the price level as much as it once did.

Is an entire nation under the spell of an expectations fairy (a central bank they think won't allow inflation)?  Or is the currency less efficient at carrying information as it once was?

Which makes more sense to you?

Footnotes:

[1] In thermodynamics terms, adding Yen both makes the economy larger (medium of exchange) and colder (unit of account). Maybe a good analogy is that money being added to the economy by the central bank is "cold" (not being used for anything), so it "cools down" the economy over the long run.

[2] This is intimately linked to the "inverted yield curve" as an indicator of recessions.

[3] For reference, here are MB and M0:


Saturday, October 4, 2014

Updated (non-existent) 3D Phillips curve with PCE inflation

This is an update of the graphs at this post with core PCE inflation instead of core CPI inflation as well as using this trend extracted here:


Here are the 3D graphs (two different views) showing the relationship between inflation and unemployment over time:


And here is the relationship in 2D (with the rainbow representing the blue curve above, with 1960s in purple, through the 2000s in red):


It really seems like the Phillips curve isn't a stable relationship and the patterns seen are pretty meaningless.

Wednesday, October 1, 2014

Wage stickiness is an entropic force

David Glasner has a post up about the hegemony of new classical economics through "microfoundations"; this latest take put the question in an interesting way that goes well with what I've been thinking about lately:
In chapter 19 of the General Theory, Keynes struggled to come up with a convincing general explanation for the failure of nominal-wage reductions to clear the labor market. Instead, he offered an assortment of seemingly ad hoc arguments about why nominal-wage adjustments would not succeed in reducing unemployment, enabling all workers willing to work at the prevailing wage to find employment at that wage. This forced Keynesians into the awkward position of relying on an argument — wages tend to be sticky, especially in the downward direction — that was not really different from one used by the “Classical Economists” excoriated by Keynes to explain high unemployment: that rigidities in the price system – often politically imposed rigidities – prevented wage and price adjustments from equilibrating demand with supply in the textbook fashion.
Why, in a recession, don't people take wage cuts to clear the labor market?

I think I have an answer: entropy. There is nothing stopping anyone from making the adjustments, it's just highly unlikely that the adjustments will be made (or another way, it is highly unlikely for the economy to find itself in a state where the adjustments have been made). People are pushing against the headwind of an entropic force -- an entropic force that is known by its economics discipline name of sticky wages.

That's why it would be hard to come up with a microfounded explanation for the lack of nominal wage reductions -- there is no microeconomic reason. Sticky wages disappear as you get a smaller and smaller economy, going from macro down to the micro level. A single glue molecule is not sticky and individual molecules do not undergo diffusion.

Let me try an explanation. Nominal wages (NW) are remarkably correlated with NGDP -- in fact, NGDP = 2.1 NW to a very good approximation. So lets assume that nominal wage growth in a given industry (or company) is proportional to [the growth of] that industry's contribution to NGDP. We can then borrow the picture from this post to talk about the distribution of wage growth:


The mean and variance of this distribution is set by macroeconomic variables -- like NGDP and the money supply [1].

If one person takes a nominal wage cut, he or she would move along the red arrow to a position on the negative growth side to the left of the vertical line. It doesn't impact the shape of the distribution too much. However, if lots of people do it, you'd end up with a different distribution:


If this were a thermodynamic variable, the particles on the left side would "experience" an entropic force to return to the original distribution .. because that original distribution represented the most likely configuration consistent with the macro scale variables. The individual particles wouldn't actually feel any force, they'd just end up by random chance back in the most likely configuration.

Well, in the information transfer picture, the labor force would experience that same entropic force. That is to say, they wouldn't feel anything themselves -- in aggregate the labor force would just keep the same distribution of nominal wage growth. Some people would move up, some down. The distribution of wages would have a tendency to stay the same since they are set by macro variables, few people end up with negative nominal wage adjustments to an exogenous shock and wages appear to be "sticky" [2].

Right now you might be saying: "Wait, how can a recession happen at all in this picture?" There are two ways. One is to throw people out of this distribution in proportion to the distribution itself (subtracting a Gaussian from a Gaussian with the same mean and variance is just a re-normalized Gaussian with the same mean and variance). In this case unemployment spikes and you get a one time drop in NGDP that reduces the average growth rate going forward (see footnote [1]). This picture is below:


This mechanism predicts that the distribution of the wage growth of the about-to-be unemployed before the layoffs is roughly the same as the wage growth distribution of the employed before the layoffs. That is to say most people laid off would have had the average wage growth of the employed before the layoffs -- that people with low wage growth or high wage growth prior to the layoffs are not over- or under-represented in layoffs.

The second way is for the market to stop transferring information, prices stop detecting the information flow and nominal wage growth freezes (goes to zero -- see e.g. here [link fixed 10/3/2014]). If I(D) is the information source (demand) and I(S) is the information destination (supply), then this represents a case where I(S) < I(D). It could be described as a coordination failure (the information in peoples' expectations is lost as their inconsistent plans fall apart) or incorrect expectations which lead to information loss.

The first way, we maintain I(S) ≈ I(D); second way is a market failure -- I(S) ≠ I(D). My opinion is that a little of both happens. Its a bit like trying to get the price tag sticker [2] off of birthday card and ripping the card in the process. Your fight with entropy is partially successful and partially system failure. In this analogy, the economy is the card, the soon-to-be unemployed are the price sticker and you are acting as the economic shock to the system.

Footnotes:

[1] In particular, using the partition function approach, the mean of the wage growth distribution is ~ log NGDP/log M and the variance is ~ 1/log M.


[2] An entropic force we experience in our everyday lives is the stickiness of glue. There is literally nothing you are fighting against when you try to peel a price tag off something ... except entropy.

The lucky streak of Bill Gross

Bill Gross is in this news with his sudden departure from PIMCO and move to Janus. Everyone is saying what a great bond investor he is. I tend to subscribe to the theory that if you have millions of people investing in something, some small number will be 6 sigma or more away by random chance. The other key is to get in on a trend at the right time:


Gross published his first "Investment Outlook" in September of 1981 at the point of the highest interest rate (lowest price for US Treasuries). He leaves PIMCO in September of 2014 after a 33 year bull market in US Treasuries (rising price, falling interest rate). Of course he's going to look like some kind of genius.

This trend might even have been a predictable outcome of the information transfer model from the 1970s since the key pieces of knowledge are a generally growing economy and a falling trend in inflation.

Now there is something to be said of not messing everything up before your 70s. It's one of those "let go of the control column and let the plane level itself" situations in the cockpits of modern passenger aircraft.