The question of what exactly economic growth is, and how it works, has been around for awhile. It continues to this day -- for example in Paul Krugman's review from today of Robert Gordon's The Rise and Fall of American Growth, we have a technology story:
Gordon [declares] that the kind of rapid economic growth we still consider our due, and expect to continue forever, was in fact a one-time-only event. First came the Great Inventions, almost all dating from the late 19th century. Then came refinement and exploitation of those inventions — a process that took time, and exerted its peak effect on economic growth between 1920 and 1970.
This is part of a technology advancement view of economic growth that's been around since the dawn of modern economics (after the theories of "having all the gold" and "having all the productive land" went nowhere). Today the largest component of economic growth is captured in a measure called total factor productivity often attributed to "technology". Real business cycle theory even attributed the business cycle to "technology shocks".
One probable reason for this theory's persistence is that economic growth itself (at least as we view it today) seems to start in the 1700s with the industrial revolution. Interestingly, this is also when central banks got their start ... along with various quantity theories of money (as opposed to the "quantity theories of technology" above).
Last Friday, I put together a simple, yet empirically effective model of inflation that were the beginnings of what could be called a "quantity theory of labor". I'd like to put forward the idea that maybe economic growth in the long run has nothing to do with money or technology. Instead it is all about information equilibrium (see my paper) between nominal output and the labor force.
Let's start with the information equilibrium relationship
where CPI is core CPI, NGDP is nominal output and CLF is the civilian labor force. In information equilibrium, we can solve the information equilibrium differential equation (which the previous notation stands for) in general equilibrium to obtain:
CPI = (n/c) k (CLF/c)ᵏ⁻¹
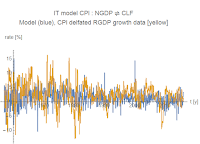
with n and c being constants and k being the information transfer index. How well does this work empirically? Very well -- for such a simple model. I show nominal output, nominal growth and the inflation rate:


The yellow curves are data and the blue curves are the model above. I fit the parameters to both equations simultaneously, resulting in an IT index k ≈ 4.0. One way to interpret this geometrically is that if the CLF is the radius of a 4-sphere, NGDP is proportional to its 4-volume and CPI is proportional to the 3-volume of its surface.
How do we get business cycle fluctuations in this model?
One way would be with a "sunspot" model, potentially with the central bank acting as Roger Farmer's Mr. W (the coordinating source of "sunspots") in his paper [pdf] Global Sunspots and Asset Prices in a Monetary Economy:
What coordinates beliefs on a sunspot equilibrium? Suppose that Mr. A and Mr. B believe the writing of an influential financial journalist, Mr. W. Mr. W writes a weekly column for the fictitious Lombard Street Journal and his writing is known to be an uncannily accurate prediction of asset prices. Mr. W only ever writes two types of article; one of them, his optimistic piece, has historically been associated with a 10% increase in the price of trees. His second, pessimistic piece, is always associated with a 10% fall in the price of trees.
Mr. A and Mr. B are both aware that Mr. W makes accurate predictions and, wishing to insure against wealth fluctuations, they use the articles of Mr. W to write a contract. In the event that Mr. W writes an optimistic piece, Mr. A agrees, in advance, that he will transfer wealth to Mr. B. In the event that Mr. W writes a pessimistic piece, the transfer is in the other direction. These contracts have the effect of ensuring that Mr. W’s predictions are self-fulfilling.
In the model in this post, the Fed would occasionally give pessimistic forecasts, leading to downturns. However I'd propose a more agnostic view of spontaneous coordination in open markets leading to non-ideal information transfer. If information transfer is non-ideal, we can only put bounds on the macro variables:
CPI < (n/c) k (CLF/c)ᵏ⁻¹
We'd have a fall in CLF from non-ideal information transfer, which would lead to a fall in nominal output. This leads to a temporary shock to the price level. Here's an animation (I plan on updating this later [update: updated] to show it in the presence of economic growth) where D (aggregate demand) represents NGDP and S represents CLF (labor supply):


There are some pretty wild implications of this model. It means the Fed has little control of the economy (except to potentially crash it). It means monetary theories aren't necessarily causal in the traditional sense. They could have something to do with non-ideal information transfer -- the mechanism of market failure -- but during "normal times" monetary policy is irrelevant. It means "Keynesian" theories work inasmuch as they increase the size of the labor force; other mechanisms of fiscal stimulus (e.g. via inflation) are irrelevant. It's also interesting that even people without jobs but still considered "in the labor force" are important. And if this were a Solow model, we'd have labor with an exponent of 4 and capital with an exponent of 0 (and increasing returns to scale).
It also means Gordon's story of technological innovation above is irrelevant except through ways that technology allow more people to be a part of the labor force. But the biggest factors impacting the labor force in the time period Gordon references was the entry of women and African Americans -- social and political factors, not technological. The economic boom associated with the industrial revolution would have been about people leaving subsistence farming for industrial labor force. A similar story probably applies to China.
It's true this is an incredibly simplistic view of an economy -- it's made out of people. But maybe we should take something incredibly simple like this to be a starting point for macroeconomic study?
...
PS This doesn't mean income/nominal output is allocated proportionally to each member of the labor force. In fact, it would probably have some kind of maximum entropy distribution with a constrained value of < log w > where w is income -- a Pareto distribution -- unless government redistributive policies intervened.
...
Update 27 January 2016
I was asked for a graph of (CPI deflated) RGDP growth using this model. I have provided both a comparison with NGDP/CPI as well as the RGDP growth data directly from FRED (deflated via the GDP deflator). Neither seem to do very well -- the issue is essentially the compounding of model and measurement error from the CPI data and the NGDP data. The average RGDP growth rate from the model is systematically low. The fit objective function above was chosen to minimize the difference between the models and the NGDP and CPI level data, and a different objective function could be chosen to optimize all three level measures, or optimize all three rate measures.

...
PS This doesn't mean income/nominal output is allocated proportionally to each member of the labor force. In fact, it would probably have some kind of maximum entropy distribution with a constrained value of < log w > where w is income -- a Pareto distribution -- unless government redistributive policies intervened.
...
Update 27 January 2016
I was asked for a graph of (CPI deflated) RGDP growth using this model. I have provided both a comparison with NGDP/CPI as well as the RGDP growth data directly from FRED (deflated via the GDP deflator). Neither seem to do very well -- the issue is essentially the compounding of model and measurement error from the CPI data and the NGDP data. The average RGDP growth rate from the model is systematically low. The fit objective function above was chosen to minimize the difference between the models and the NGDP and CPI level data, and a different objective function could be chosen to optimize all three level measures, or optimize all three rate measures.


1) In Farmer's story, I don't see the connection between the contract that Mr. A and Mr. B agree to and the price of trees. So A and B are taking opposite sides of a bet on Mr. W's articles, but I don't how that possibly affects the price of trees and thus makes Mr. W's articles self fulfilling prophecies.
ReplyDelete2) "We'd have a fall in CLF from non-ideal information transfer,..." Can you give an example of this in the real world? Since the unemployed are counted in the CLF, what's a plausible example of non-ideal information transfer that would cause the CLF to drop? A bunch of people recruited into the military and then killed in a war perhaps? Mass incarceration due to harsh mandatory sentencing? Does "unemployed" in the definition of CLF mean people who want to be employed?
3) My question I left at your previous post.
Farmer's model is a heterogeneous agent model and A and B are the two kinds of agents.
DeleteIf you look at the growth rate of CLF, it changes in response to the business cycle. People that were unemployed when the recession hit might decide to give up on looking for a job.
It's true that causality isn't as cut and dried for NGDP and CLF.
Regarding population growth, it's not the same thing as CLF growth. Slight deflation could mean people leaving the labor force for subsistence farming (settling of the west). I will look into it in more detail, though.
Very interesting. However, it has me wondering about your caveat at the end: PS This doesn't mean income/nominal output is allocated proportionally to each member of the labor force. In fact, it would probably have some kind of maximum entropy distribution with a constrained value of < log w > where w is income -- a Pareto distribution -- unless government redistributive policies intervened.
ReplyDeleteFor the purposes of this very simple exercise, how would changes in the pareto distribution of income affect growth?
Also, this exercise, to my mind, does not exclude technical innovation or societal changes as having some import. For instance, the GDP per capita of some countries is **much** higher than the GDP per capita of other countries, even given similar labor force participation/growth rates. There must be a cause in terms of kappa differing among countries, related to the efficiency? of an amount of given labor contributing to GDP. It can't be just labor alone- that would imply the labor theory of value, long ago debunked. After all, doing brain surgery is really hard, and requires a lot of training, and therefore should be compensated a lot. Doing brain surgery while standing on one leg is a lot harder, and therefore should we compensate it much more?
The IT index is one of those things that you end up with when you sum up all the effects of all of the parameters of the individual agent models. The differences between different IT indices would be due to differences in micro agents in the same way that different heat capacities are due to the different kinds of molecules.
DeleteAnd it's not really a labor theory of value. It's a quantity theory of labor -- quite different. No matter how much product an existing laborer produces, that laborer only contributes to output inasmuch as he or she doesn't leave the labor force. And marginal entrant adds the same amount to growth regardless of whether they are full time or part time. (The mix probably goes into a value of k, but it's been remarkably stable over 60+ years.)
As far as how differences in the distribution would affect growth, I have my suspicions (more equal society leads to more growth assuming the same labor force growth rate), but I don't know for sure.
What contributes to the value of an IT index would be interesting to study. Clearly the "quantity" of labor is not something that is likely to continue to increase greatly in the future for industrialized countries, especially not anywhere near the rate to which it has historically. However, how to maximize the values of the molecules (labor) in terms of improved GDP should be a branch of information transfer economics.
DeleteI'd agree, but I am only one person with a day job :)
DeleteAs an aside, I thought of a new way to think about information transfer model for brain waves ... you would take the two functions to be plane waves. Instead of the IT model relating growth rates
N ~ exp k m t
M ~ exp m t
You are relating frequencies (sample rate r)
V ~ exp i k r t
t ~ exp i r t
Probably needs a bit more fleshing out, but could be much clearer to reviewers.
Being busy- I can relate! We just published a paper last month that, to my mind, casts some doubt as to the brain wave hypothesis- looks a lot more like avalanches. I will email. I will find somewhere for our work, not to worry.
DeleteJason, in your view are the CLF models of core CPI and NGDP good candidates for a Granger causation analysis?
ReplyDeleteI'm not sure anything is a good candidate for Granger causality analysis. "Assuming we know everything about A and B, A does not cause B." is not a very scientific statement. Also, information equilibrium is not really about causality -- it goes both ways.
DeleteBut given those caveats, you probably could say something about CPI (actually, I did -- with one lag of about 4 months, CLF "causes" CPI) -- but the data is too noisy and smoothing-method dependent to say anything about NGDP.
It does look a bit like growth shocks come before labor shocks. And e.g. this paper found that growth causes immigration:
http://ftp.iza.org/dp5853.pdf
But really, people entering the labor force should cause growth and growth should pull people into the labor force -- US lack of growth since 2009 has been a big factor in lower immigration from Mexico. High growth pulls in immigrants. I don't see why it also wouldn't pull non-immigrants into the labor force as well.
That is to say, causality should go both ways -- like the IT model says. Information flowing back and forth maintaining information equilibrium.
"I'm not sure anything is a good candidate for Granger causality analysis."
DeleteLol... well, that gets straight to the point!
Looking at my desk this morning, I think one of the reasons I feel an affinity for this blog is its emphasis on maximum entropy. It practically makes a virtue of it.
ReplyDeletePerhaps a good boy's first & middle name could be "Maximilian Entropy" or "MaxEnt" for short. "Maxine Entropía" for girls. (I Googled that latter one and got nothing... so it'd be unique!)
One of my co-workers has a sign on his wall that says:
"Organization is for people who are too lazy to look for things."
Well, if you have a model for NGDP and a model for CPI, then you must have a model for RGDP too, right? What's it look like?
ReplyDeleteIt sure is -- at least for "CPI deflated" RGDP. Will have an update shortly ...
DeleteAnd it's up. It's not as pretty due to essentially combining measurement noise and model error in CPI and NGDP.
DeleteThis comment has been removed by the author.
DeleteYour level plots are a lot less noisy than the rate plots in general. Since you say the model gives systemically low rates, I'd imagine the corresponding level plots would show the model undershooting with a larger and larger gap over time?
DeleteThey're also a lot more spurious (think looking at MB vs PCE since 2009).
DeleteBut the level result for RGDP is actually too high in the 1960s and too low in the 2000s.
Again, you could change the weights in the objective function to get RGDP, CPI or NGDP right on the nose to the detriment of the other two (or one).
Sorry, I think I asked this before but I forgot on which post:
ReplyDelete1) In your two animations above: for the top one (NGDP), NGDP is analogous to the entropy of the dots in the D box (on the left), correct? The linear looking ramp of NGDP decreasing corresponds to you exogenously removing dots from the D box at a constant rate over some period of time T. Once you stop doing this, entropy starts to rise again in the D box due to the entropic force of there being a greater number of dots in the S box, and the probability of any one dot crossing from D to S or from S to D is constant. This entropic force equalizes the mean number of dots in each box. Entropy in D does not rise all the way back to it's starting value however, because the overall number of dots in both D and S is now fewer, so D ends up with a lower mean number of dots.
2) In the price animation, p = kD/S so as you reduce D, S changes more slowly than D, so p trends downwards. When the entropic force has done its magic and has restored D = S again, then we arrive back at our original price simply because D = S just like the animation starts out.
Is that basically correct?
2)
Yes.
DeleteAs for the non-ideal curves in both animations, those could be produced simply by limiting the total number of dots?
DeleteOr by somehow modeling resistance to dots moving between boxes: perhaps by giving each dot a sightly higher probability of staying in its own box rather than crossing over to the other box.
Of course I could dream up more complex models as well, but I doubt you did anything too complex.
Maybe you just drew an arbitrary curve that looked about right. :D
If you did anything with "the dots", you'd get impacts in the ideal curve (because you are actually affecting entropy).
DeleteThe way to get non-ideal is simply to not add up all of the information entropy on the supply side (not all demand information gets to the supply) -- or multiply it by some number x < 1. It could take any functional form you wanted vs time because it represents some effect that isn't part of the information equilibrium framework. In this case the effect increases a bit during the "recession".
Jason, on my Android ("Droid") phone, the "k" exponent doesn't show up at all and the "k-1" exponent appears as " 1"
ReplyDeleteDo you have any problem on your phone?
Nope; it's probably your browser's rendering of unicode.
DeleteYep. Chrome fails, but Firefox did OK.
DeleteSomething Avon Barksdale quoted from David Levine in a follow up to his last comment:
ReplyDelete"Keynesianism as argued by people such as Paul Krugman and Brad DeLong is a theory without people either rational or irrational..."
The full quote is critical of Keynesianism as being a complete failure (while ironically implying that Lucas, Prescott and Sargent ushered in a new era of [empirical?] success with their "macroeconomics with people").
I thought I'd give him a link to your post about taking people out of econ, when it suddenly occurred to me that the title of this post here seems (on the surface anyway) at odds with the sentiments expressed in that older post of yours:
"On taking the people out of economics"
I think I get it (your old post was critical of getting inside the heads of individual people to explain macro, while this one speaks of people being important as a mass quantity).
Using your handy search box, I see that a different quote from Levine set you off on that entertaining rant you rescued.
Delete"Keynesianism as argued by people such as Paul Krugman and Brad DeLong is a theory without people either rational or irrational..."
DeleteThat is just false.
http://krugman.blogs.nytimes.com/2013/11/18/the-new-keynesian-case-for-fiscal-policy-wonkish/
Paul Krugman and Brad DeLong use the IS-LM model to explain their results, but if you read the above post, Krugman mentions "Euler condition" which is an indifference relationship for a rational agent.
Even if that weren't the case, the crossing curves in an IS-LM model represent an individuals' trade-off between liquid assets. The freaking L in ISLM means Liquidity preference!
And Brad DeLong has expressed the liquidity trap as a shortage of safe assets. There is definitely an agent involved in order to consider something safe.
So the idea that the Keynesianism of Krugman and DeLong doesn't have agents is just flat out wrong.
Good point! I missed that whole series of posts (Krugman, DeLong, Rowe, Williamson, Cochrane) initiated by David Levine last March (the one Avon quotes from), so I tried to get caught up.
DeleteIn the end I decided to keep silent, but I see you left him a comment.
This comment has been removed by the author.
DeleteI tried to find somewhere where he says what's wrong with it:
Delete"Standard Keynesian ISLM is just plain wrong. It is like teaching blood letting in medicine. There is no proper micro foundation, it is not recursive, and it does not have a game theory interpretation. It is a bad fairytale. This stuff was discredited long ago. Not a single policy simulation from a Keynesian model has appeared in a respectable journal since 1980. I see little point in teaching it to undergraduates."
http://worthwhile.typepad.com/worthwhile_canadian_initi/2014/06/teaching-general-principles-of-macro.html?cid=6a00d83451688169e201a3fd18cf06970b#comment-6a00d83451688169e201a3fd18cf06970b
I think Krugman pretty well establishes the reason ISLM fell into disfavor was political, not empirical.
You can't say definitively microfoundations are required until you have built an empirically accurate theory that depends critically on micro parameters. It's like declaring that there are no atoms in the ideal gas law, so it must be wrong.
And so we know that game theory is the correct final theory of economics?
Well, then ... we might as well just stop all the research! Avon found it! Just do game theory. Sure it doesn't seem to get the solution to the dictator problem right in controlled experiments, but it must be fundamentally true! Because reasons!
http://informationtransfereconomics.blogspot.com/2015/11/maximum-entropy-better-than-game-theory.html
Avon also mentions (in the same comment) something positive about John Cochrane being a physicist. Well, Cochrane (like Noah Smith and Paul Romer -- kinda) has an undergraduate degree in physics. I wrote about how there's a different attitude that comes out of a graduate education ...
http://informationtransfereconomics.blogspot.com/2015/09/physics.html
I think that attitude lets you see the IS-LM model as an effective theory, whereas an undergraduate would ask why you wouldn't skip Newtonian physics and calculate everything with quantum mechanics.
There's a reason why ISLM hasn't been used much since the 1930s. It's an effective theory of low inflation. Inflation has been relatively high since the 1970s until only fairly recently.
And no self-respecting physicist with a phd would put those Et operators in an equation like Cochrane does in his book Asset Pricing.
I enjoyed this one of yours (concerning a Levine quote) too.
DeleteJason, thanks for responding to my erased comment. I decided I should make sure I wasn't hallucinating about that, but then figured I'd just erase it instead. Looks like I wasn't hallucinating.
DeleteRegarding assumptions about game theory: Well said.
Avon responded:
Delete"I know what ISLM is. It's not recursive so it really doesn't have people in it. The dynamics are not set by any micro-foundation. If you'd like to see models with people in them, try Ljungqvist and Sargent, Recursive Macroeconomic Theory."
He obviously doesn't know what ISLM is.
DeleteThat's also a very restrictive definition of "people". In fact, it's wrong -- humans don't optimize the dictator game.
I think Cosma Shalizi put it best:
"Alas, experimental psychology, and still more experimental economics, amply demonstrate that empirically it's just wrong."
http://bactra.org/weblog/517.html
I hope you've subscribed to that thread, because he responds again. This is definitely some pop-corn munching entertainment for me! Lol. (although I wish he'd comment here to avoid irritating Nick Rowe... although I don't see how Nick wouldn't find it as entertaining as I do!)
DeleteThis comment has been removed by the author.
DeleteThis comment has been removed by the author.
Delete... I'm not saying his science rants aren't warranted. I sometimes enjoy a science rant that hits the mark. But he implies that any scientist can clearly see the scientific superiority of his favorite economic theories when you're living proof that's not always the case.
Delete...that is, until he convinces you to change your mind anyway. God help us if that happens!
This comment has been removed by the author.
DeleteI hope Avon accepts your invitation to check your work out here on this blog. Meanwhile, are you familiar with "Ljungqvist and Sargent, Recursive Macroeconomic Theory," which Avon is apparently impressed with?
DeleteIf some regular communication channel is opened up between you and him, It'll be fascinating to see if one of you convinces the other, or if you meet somewhere in the middle, or neither of you change positions at all, or perhaps even gravitate further apart.
It'd be fun to see an empirical "showdown" (lasting the next 25 years or more? Lol) wherein you both bring your best frameworks/models to the game. It's fairly clear where your empirical tests are (you share them here), but unless Ljungqvist and Sargent (for example) are the keepers of Avon's preferred framework's empirical results, you're ahead of the game in that respect AFAIK... at least apparently so in the blog world.
Macro seems depressingly like religion argued with math. Well, if you're lucky you get the math. If you're really lucky you get the theoretical framework, the math, the code, the forecasts, the line-in-the-sand a priori consensus commitments to what would likely constitute failure, and the data.
Jason, David Glasner had some thoughts on your interchange on Rowe's blog.
DeleteI'll have to put up a post on how the intertemporal budget constraint can be interpreted as an effective theory.
DeleteThere are a limited number of economic states reachable versus time, which can be interpreted as an IBC.
As I was reading your comment on increased labor participation by women and African Americans, it came to me this idea that I first read in a paper by Lemin Wu that's something like this:
ReplyDelete- The usual story of economic growth before the Industrial Revolution is that there was none. Living standards were low and constant throughout the ages. Many linked this to Malthusian constrains.
- However, the historical record shows periods where this Malthusian constraint seems not to have applied (some economic historians say that this was just a temporary shock that will soon correct itself but Lemin Wu will argue that this is not so), e.g. in Imperial Rome and Song China
- Why were this epochs able to escape from their Malthusian constraint?
- Lemin Wu's theory, and he provides plenty of evidence for it, is such: suppose there are 2 goods in an economy: 1 essential good that affects population growth (possible IE mechanism here?) and 1 luxury good that does not affect population growth and as such increases per capita income (since no new babies to take that increase away)
- What happened then it those economies was that their production structures was shifted towards the production of luxury goods, enabling real growth to happen.
- Urbanization plays a big role here, as labourers migrate from agricultural jobs and areas to cities to work in producing luxury goods. This was the connection I made with your comment.
Anyway, thinking out loud here. Need to marinate Fieltz and Borchard (2014) and your paper for a while in my head before I try to tackle this fully.
I have only barely touched on the subject of proto-macroeconomies, but I have three posts that note my thinking ...
Deletehttp://informationtransfereconomics.blogspot.com/2015/09/the-price-revolution-and-non-ideal.html
http://informationtransfereconomics.blogspot.com/2015/10/can-we-extrapolate-growth-into-distant.html
http://informationtransfereconomics.blogspot.com/2015/10/what-is-real-growth.html
While I talk about it as a one-time transition, there is no reason it couldn't happen multiple times and in multiple regions.
Ah thanks, I was looking for some posts like that but my google-fu wasn't helping.
Delete