Wednesday, September 30, 2015

Information equilibrium and the taxation of capital

Brad DeLong links us to Marshall Steinbaum, who mentions a rationale behind zero tax rates for capital:
... the ideological justification for low and falling rates of taxation on capital is the Chamley–Judd Theorem, which “proves” that the optimal tax rate on capital is zero in the long run. According to the theorem, anything more destroys the incentive to save and thus the productive capacity of the economy.
In the information transfer model, we don't have intertemporal maximization via decisions based on rates of return or utility. The aspect of the model that produces consumption smoothing and the resulting capital investment is simply the existence of many time periods. Because there are many time periods, creating a high dimensional space (each time period is a dimension), nearly all the points are close to the boundary -- even for random agent choices. That is a distribution which tends to maximize most commonly used utility functions. That includes the function used by Judd [pdf].

Therefore, since capital taxation doesn't change the random behavior of the agents, you don't get agents changing their intertemporal optimization.

Tuesday, September 29, 2015

A random walk inside the simplex

I thought I'd do something similar to this post for the idea behind these two posts ([1], [2]): that most of the points in a high dimensional space are near the boundary. Here is an example random walk over d = 3 goods (3 dimensions) restricted to the simplex bounded by the budget constraint Σ ci ≤ 1:


And here is the resulting "total consumption", i.e. the sum of the consumption of each good (1 means the ensemble of agents spends all of their money in that time period):


If you increase the number of goods to d = 20, you get a similar result, but closer to the boundary:


The deviations from Σ ci = 1 represent "recessions" where the ensemble of agents saved (reduced consumption) more than usual.

The Phillips curve and the information transfer index


Brad DeLong wrote about the Phillips curve yesterday, which inspired me to take on the Phillips curve again. I've long tried to understand it with the information transfer model. In my most recent attempt I noted that with constant information transfer index $\kappa$, there is no direct relationship between employment and inflation [1].

However, that leaves out changing $\kappa$ (I sometimes use the inverse and label it $k$). The model (see the draft paper) uses the form

$$
\frac{1}{k} = \kappa = \frac{\log M/(\gamma M_{0})}{\log N/(\gamma M_{0})}
$$

which means that a shock to $N =$ NGDP (a recession) is a shock to $\kappa$. That is how NGDP changes can impact the price level. The question is: what is the magnitude of the impact on inflation?

I solved for the coefficient of the leading order term in $\delta N$ taking $N \rightarrow N + \delta N$, deriving the coefficient $\alpha$ such that $\delta \pi \simeq \alpha \delta N/N$. Here is $\alpha$ vs time:


We can see that $\alpha$ is positive (and approximately 0.05) through the 60s and 70s, falling to approximately zero by the year 2000. That is to say a negative shock to NGDP reduces inflation during the 60s and 70s -- an NGDP shock of 5% should reduce inflation by 0.25 percentage points.

Now according to the link [1] above, NGDP shocks are roughly equal to labor shocks, so

$$
\delta \pi \simeq \alpha \frac{\delta N}{N} \simeq \alpha \frac{\delta L}{L}
$$

That means a negative shock to labor (a rise in unemployment) should result in a lower inflation rate. That is the traditional Phillips curve. It basically goes away after the 1970s -- interestingly coinciding with the adoption of the expectation-augmented version.

Monday, September 28, 2015

In case of deletion ...

"Of course, at some point your ability to build ever bigger particle colliders will fail, so you can never verify that you have The Final Theory of Everything." 
While true of purpose-built accelerators, there are other ways to access higher energies -- the universe itself is a low luminosity 10^10 GeV accelerator accessible by data-mining cosmic ray events. That gets us most of the way (logarithmically) to the Planck scale. We'd just have to change our idea of experiments from contemporaneous groups to a "generation ship" model. 
And that could be a good way to think about empirical economics -- we've only had a few decades of decent macro data. Maybe we need to wait it out a few more decades before we can draw any macro conclusions ... 
http://informationtransfereconomics.blogspot.com/2015/06/its-only-crisis-if-theres-no-foundation.html

[And now it's gone ... and I have no idea why ...]

Saturday, September 26, 2015

Updated the draft paper

I updated the draft paper (now v2) after some reviews from Peter Fielitz, Guenter Borchardt and Tom Brown (many thanks to them). Have a look and let me know if my Google Drive settings are appropriate and you can download it. This includes the new notation for an information equilibrium model.

A return to deflation in Japan wouldn't be out of the cards

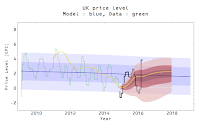
Tyler Cowen is puzzled by deflation in Japan, Scott Sumner replies and says there's no puzzle (looking at core inflation). It would be really nice if either of them could give a graph with a line and maybe some error bands where they'd expect inflation (or the price level) will be. Like this:


That's the latest update of the core CPI price level in Japan (the last update is here).

The question is why is this happening? Japan is still printing physical currency (M0) at an average rate of between 3 and 4% per year and averaging a few percent nominal growth. Cowen seems to blame credibility (and low velocity).

In the information transfer model, this is actually a long run trend across all economies:


And it points to the existence of an "economic temperature" that goes as 1/log M0. There is more discussion in my draft paper (the section on statistical economics), but in general as economies grow the most likely state for a given Yen (or Dollar or Pound) is facilitating a transaction in a low growth market. Eventually the information content of a Yen of money is equal to the information content of a Yen of output.

Friday, September 25, 2015

An MZM quantity theory?

Vincent Cate points out (on his blog) that the velocity of MZM (money with zero maturity) matches up quite well with the 10-year Treasury interest rate (from FRED):


I had actually noticed this before based on a question from Tom Brown, but I hadn't seen the significance regarding the velocity of money in the previous post until Vincent pointed it out. This version of the quantity theory looks like

PY/M = V ~ a i + b

where i is the long term (10-year) nominal interest rate. So the quantity theory model where velocity isn't constant (V ~ c), but rather determined by the interest rate (V ~ i) does look like a successful model that avoids the issues of circularity involving unobservables in my previous post.

Interestingly, this is also an information transfer model where PY = NGDP, M = MZM with detector i, i.e. (i ⇄ p) : NGDP ⇄ MZM such that

c log NGDP/MZM - k = log i
 
with c = 0.55 and k = 4.27 (see here). 


One could see three different measures of money supply corresponding to three different things

MZM :: long interest rate
M0 :: inflation
MB :: short interest rate

These are also my three favorite money supply measures because they are the least arbitrary. Measures like M1 and M2 include some things (like bank deposits) but not others (like money market funds) because they weren't deemed important at the time. MZM has a rule to determine what goes in (zero maturity) and M0 is physical currency that has a physical reality.

However I do like the simplicity of the single equation for long and short rates in the model I present in the draft paper (as well as the NGDP-M0 path), but really it's up to empirical analysis to determine which is better. (And for what purpose ... policy? forecasts?)

Thursday, September 24, 2015

The unobservables


"Tight money leads to lower expected future NGDP growth. I don’t think that can be disputed."

No, Scott, it really can't be disputed ... because you define "tight" money by lower future expected NGDP growth.

Coupled with my post on Wicksell earlier this week, Sumner's post made me think a bit about what I'll call the unobservables: a collection of macroeconomic properties that cannot be directly measured. This list is not meant to be exhaustive, but here are some key ones [1]:
  • The natural rate of interest
  • The natural rate of unemployment/NAIRU
  • The "stance" of monetary policy
  • Inflation expectations
  • The velocity of money
What do these all have in common? They're all directly linked to an observable: inflation. Scott Sumner does mix it up a bit by keying in on NGDP growth (= inflation + RGDP growth). So the unobservables are all linked to a specific mechanism of (accelerating) inflation:
  • Interest rates too low (price of money too low)
  • Unemployment too low (wage-price spiral)
  • Expansionary monetary policy (supply and demand for money)
  • Agents expect inflation (rational expectations, adaptive expectations)
  • Money supply increases (at constant velocity)
This leaves out a couple of additional mechanisms like supply shocks (which aren't monetary policy and thus considered more "real") and the neo-Fisherite view that high interest rates lead to inflation (via a specific expectations mechanism). But essentially we have a list of ideas people had about what causes inflation combined with an unobservable factor that determines how/when the mechanism works. Here's a generic way of putting this:
We get a fire when temperature is above the natural temperature of phlogiston.
How do we determine the natural temperature of phlogiston? We observe a fire.
That's how you get falling estimates of the natural rate of interest [pdf] or unemployment, or falling velocity. And that's how you get Scott Sumner calling monetary policy "tight" since the 2008 recession. I don't mean to say that is hasn't been "tight", just that "tight" is kind of a circular definition.

Of all of the mechanism/unobservable combinations above, only one rises a bit above the circular phlogiston example. That is inflation expectations -- purportedly measured by TIPS spreads (the difference between the interest rate on a regular treasury bond and its inflation-protected cousin). But the problem is that inflation expectations measured by TIPS spreads seem to be entirely backward looking (or see here) or at least strongly dependent on previous inflation when inflation isn't high (see e.g. here H/T Mark Thoma). The only unobservable that has at least a theoretical way to measure it turns out to get it wrong. So either inflation expectations don't have a strong effect on inflation or things like TIPS spreads don't measure inflation expectations correctly.

And really, when you're comparing your measure of inflation expectations to actual inflation to see how much of an impact inflation expectations had, you've basically started to measure the temperature of phlogiston.

Now don't get me wrong: I'm not against the idea of an unobservable! As a physicist, I've frequently used an unobservable: the wavefunction in quantum mechanics. However, you do not figure out what the wavefunction is by measuring an interference pattern and taking its square root. There is a very specific model for calculating the wavefunction (e.g. the Schrodinger equation).

And that's the issue with the macroeconomic unobservables. Most of the time there's no way to calculate them besides using the data you're trying to explain, and when you can calculate them, they turn out to be wrong (inflation expectations are backwards looking, money velocity isn't constant).

I like to think of the information transfer model as the analog of the Schrodinger equation for velocity. But really, it's the Schrodinger equation for all of these unobservables since it tells you what inflation and NGDP are going to be. "Tight" money is when interest rates are above the information equilibrium value, or when the economy is above the NGDP-M0 path (see here). The best measure of the natural rate of interest is the information equilibrium value. The best measure of the natural rate of unemployment can be calculated. Velocity is κP (though I like Cambridge k more). And κ is a measure of the relative information in a symbol of output (proportional to the log of output) to a symbol of money (proportional to the log of the amount of cash). Or (probably more accurately), the inverse of the ensemble average of all of the individual market relative growth rate factors a.

But inflation expectations -- those are bogus.

Footnotes:

[1] I left out total factor productivity because I'm focusing on monetary policy.

Wednesday, September 23, 2015

Random correlation of the day

I noticed a random correlation today:


The employment-population ratio and Federal tax (and tariff, etc) receipts to NGDP. With the exception of the structural shift in the emp-pop ratio due to women breaking into the workforce, this is pretty remarkable. There are plenty of logical explanations (e.g. taxes proportional to employed, GDP proportional to population), but is there really a good reason for the relative size of the government to be the same over the course of 60 years? There were lots of Democrats on the front half end and lots of Republicans on the back half. Neither had any impact; bupkis.

Also, the emp-pop ratio is considered by the information transfer model to be effectively constant. With the Federal revenues being even more stable (it lacks the structural shift), a fortiori, the relative size of the government sector is constant. It joins the ratio of nominal wages to nominal GDP as some of the most constant things in macroeconomics.

That is to say if you can't explain the price level over the past 60 years, what hope does your theory have for something that changes by an order of magnitude less!

PS The unemployment rate is only slightly less stable:


Price movements

One of the original directions I took on this blog was to look at stochastic paths bounded by the information equilibrium supply and demand curves ... a direction that turned out to be not very fruitful. Despite that, I thought I'd revisit it in light of two years of improving understanding.

I think the first time I used the "maximum entropy" point in the area under the supply and demand curves was here. Let's assume that is our starting point and look at a stochastic path bounded by the supply and demand curves. I assumed the log scale of prices represented the uniform density of states (and a lower bound). It looks something like this (left is log price, log p, and right is price, p):


Here is the resulting price path vs time (yellow, in the presence of inflation, and blue, the "real" price):


The bounds are shown as the solid lines and the maximum entropy price is shown by the dashed lines. Here is the distribution of price changes (in the "real" price):


Anyway, I'm not really breaking much ground here. This just shows that it's possible for price movements to look like a normal random walk, thus the information equilibrium view doesn't have to be inconsistent with the efficient markets hypothesis. However, sometimes the boundaries have an impact and you can get biases towards prices falling and staying low for awhile:


Tuesday, September 22, 2015

The price revolution and non-ideal information transfer

I'm in the process of watching Mark Thoma's online lectures on the history of economic thought. I've only made it through the first two, but in the beginning of the second lecture Thoma brings up what for him is a puzzle.

He discusses the so-called "price revolution" where inflation spiked. It didn't really spike in our modern sense, being only a few percent inflation over more than a hundred years. However, given that nominal growth at the time was also only a few percent (or less), this is significant.

The inflation is typically explained by an influx of gold from outside Europe. Thoma asks: Why didn't that inflation drive up the cost of subsistence at the same rate it drove up output prices? I think I have a pretty good picture of why, but first let's start with some equilibrium analysis (this is in the draft paper).

If we have ideal information transfer (information equilibrium), we can say in the market P : N ⇄ M (price level as the detector of information flow between aggregate demand and money supply) the following two relations hold:

N ~ Mᵏ
P ~ k Mᵏ⁻¹

Let's say M grows at some rate μ so that M ~ exp(μt). Then, if ν is the nominal output (aggregate demand) growth rate and π is the inflation rate (growth rate of the price level), then

ν/π ~ k/(k-1) ≈ 1 for k >> 1

so ν ≈ π. That is to say nominal growth is roughly equal to inflation for k >> 1 (and real growth is small). That is basically Thoma's point above.

This neglects something very important, however. Or, more accurately, we assume something we shouldn't. Thoma naturally translates the modern concept of equilibrium back into the past, but there is no particular reason we should do so. And there is definitely no reason to use information equilibrium.

Here's a picture of what could be happening to the price level:


The equilibrium analysis is the black line and a real economy near equilibrium might behave like the green line. But what we're seeing in the 1400-1500s in Europe is an initial rise of macroeconomies -- the yellow line -- and the transition from non-ideal information transfer to ideal. The influx of money makes information transfer more ideal. The observed inflation rate π in the transition region does not come from an equilibrium analysis so it not only doesn't have to have any specific relationship with ν, the associated "real rate of growth" derived from the two measures is not a theoretically valid concept.

Subsistence goods likely had markets with more ideal information transfer than other output goods (because they were traded more regularly), so the inflation (actually, a movement toward ideal markets) would be concentrated among things besides e.g. food.

Thus the inflation associated with the rise of the first quasi-modern European nation-states with quasi-modern macroeconomies need not be associated with zero real growth. Actually, a pretty good analogy is emergence from a deep depression via monetary policy.

Monday, September 21, 2015

The classical mechanics of Wicksell


Simon Wren-Lewis quotes Andrew Haldane (chief economist at the Bank of England):
QE’s effectiveness as a monetary instrument seems likely to be highly state-contingent, and hence uncertain, at least relative to interest rates. This uncertainty is not just the result of the more limited evidence base on QE than on interest rates. Rather, it is an intrinsic feature of the transmission mechanism of QE.

Haldane continues at the link on Wren-Lewis's blog:
All monetary interventions rely for their efficacy on market imperfections. The non-neutrality of interest rates relies on imperfections in goods and labour markets. Stickiness in goods prices and wages ... allow shifts in nominal interest rates to influence real activity. The effectiveness of QE relies on these goods and labour market frictions too. But it relies, in addition, on imperfections in asset markets.
Also at the link, Haldane says:
All of which has direct implications for the transmission mechanism for QE. If asset frictions are highly state-dependent and volatile, so too will be the efficacy of QE. Estimates of the impact of QE during periods of high risk premia and disturbed financial conditions may be very different than when asset markets are tranquil and risk premia low.
Let me see if I can sum up here. The effect of QE on interest rates depends on:
  • Price stickiness in goods and labor markets
  • Frictions in goods and labor markets
  • Imperfections in asset markets
  • Risk premia in asset markets
  • State-dependent asset frictions
  • ... etc (more at the link)
The more obvious conclusion, Mr. Haldane, is that QE doesn't work the way you thought ... like, at all. I'm going to put out a bold claim here that adding effect X isn't going to suddenly take you from not being able to describe the data at all to describing it really well.

Imagine if Davisson and Germer upon discovering scattering peaks from their nickel-oxide crystal target had said that "electron scattering seems likely to be highly state-contingent"? And imagine if they started to add a bunch of very complicated electromagnetic effects coupling electrons to light waves in order to reproduce the diffraction pattern?

Lucky for us, they didn't and instead used their experiment to back up de Broglie's wave-particle theory. [FYI, the data from that experiment is shown in the picture at the top of the post.]

QE doesn't seem that complicated to me. And it even works for the UK:


The macroeconomic theory everyone seems to be working with (still) is the Wicksellian natural rate of interest. Paul Krugman mentioned it today. It really does create a unifying picture the various views of quantitative easing. Imagine it as the last common ancestor of Austrian, Keynesian and monetarist theories of economics. It proposes the existence of a (not directly observable) natural rate of interest where if rates are below it, inflation accelerates and if rates are above it, inflation decelerates.

Everyone seemed to be operating under the assumption that QE would, ceteris paribus, lower interest rates below the natural rate, causing inflation to accelerate. The failure of inflation to accelerate has been rationalized in several ways (not all mutually exclusive):
  1. Not enough QE
  2. It will: next month, next year, ...
  3. Going below the natural rate requires negative nominal rates
  4. QE is expected to be taken away
  5. QE depends on conditions
  6. QE has nonlinear effects on the natural rate
There are more (including Mark Sadowski's theory that QE has actually has lead to inflation at a tiny fraction of the rate predicted by the quantity theory of money), including a #7 that I'll get to later.

No one seems to be arguing for number 1; (almost) everyone thinks the trillions of dollars (in the US) and billions of pounds (in the UK) should have shown something if they were going to.

Number 2 includes the permahawks, the inflationistas, the Austrians and people at Zero Hedge. This view is not irrefutable per se, but it's been almost a decade. Long and variable lags, indeed.

Number 3 is the liquidity trap argument.

Number 4 is part of the thinking in a version of the liquidity trap argument (Krugman's 'credible promise of irresponsibility'), but is also the monetarist view.

Number 5 is Haldane's view above, but is not limited to him.

Number 6 can be included in 5, but is also implicit in the calls for a more complicated macroeconomic theory that takes into account financial markets, behavioral factors and non-linear models.

All this leaves out the idea:
7. The Wicksellian view is wrong.
This might be hard to take. Paul Krugman says at the link above: 
As I’ve been trying to point out – and as others, notably Ben Bernanke, have also tried to point out – such monetary wisdom as we possess starts with Knut Wicksell’s concept of the natural interest rate.
Emphasis mine [3]. But it's been around for over a hundred years. It wasn't really based on data (I checked Wicksell's Interest and Prices).  Actually, you could easily make this theory fit any data you'd like. Look at interest rates set by the central bank. If there is (accelerating) inflation, interest rates are below the "natural rate" and if there isn't, rates are above the "natural rate". Since there's no indicator of what the natural rate is besides its supposed effect on inflation [1].

That is of course unless interest rates head down to zero (or very low values) and you still get disinflation. In that case the Wicksellian rate has to be very negative today and in the US we've been above it since the 1980s (hence the constantly falling inflation). With QE, we've kind of pushed the Wicksellian rate off the bottom of the graph [2].

Maybe it's time to stop coming up with new frictions or expectations and just give up on the idea of a natural rate of interest. 

PS I just found out Knut Wicksell and I have the same birthday.

Footnotes:

[1] It's similar to the market monetarist view where the indicator of the stance of monetary policy is determined by the variable it's supposed to affect ... NGDP.

[2] Interestingly, that's also a problem with market monetarism ... the economy has grown, requiring a larger monetary base, so no one can expect the central bank to take back all of the QE, hence some of the QE should have produced inflation. If the inflation rate is falling, it must mean that the inflation rate without the QE would have fallen a lot more.

[3] And after writing this, I saw that Mark Thoma put out a bunch of tweets (including a link to Krugman) making references to the natural rate. E.g. this one.

Friday, September 18, 2015

Two deep looks into microfoundations

This post represents some theoretical musings on my part ... so it's probably a bit "out there" from a typical social science or economics background. I make no claim to originality either.

Here are two recent looks into the idea of microfoundations (in economics and sociology). 
The Neoclassical Synthesis and the Mind-Body Problem (David Glasner) 
Microfoundations and mechanisms (Daniel Little)
Both writers delve into what microfoundations mean. 

Little's main point is about the relationship between microfoundations and mechanisms and his "preliminary answer" is that microfoundations are mechanisms acting on micro states. Mathematically, this is an expansion of the macro operator expectation in the macro state |Ω⟩ in a micro basis |i⟩

⟨Ω|Ô|Ω⟩ =  Σi ⟨Ω|Ô|i⟩⟨i|Ω⟩

Little then says there are some issues with this, that maybe mechanisms don't imply a level. And in the formulation above, they don't. The basis |i⟩ doesn't have to be micro states. It could be any sort of intermediate state (agents, firms, institutions)

⟨Ω|Ô|Ω⟩ =  Σx ⟨Ω|Ô|x⟩⟨x|Ω⟩

The key requirement for this to be generally true is that |x⟩ is a complete basis. To me, individual agents seems like a complete basis relative to e.g. firms because while firms may buy and sell from each other, firms also produce goods that individual agents consume. That is to say the entirety of economic activity can be stated as a bunch of data about individuals but not necessarily a bunch of data about firms [2]. 

Glasner takes issue with the representative agent model that simply asserts the equivalence of macro observables and the outcomes of micro mechanisms acting on micro degrees of freedom. If you do this, he says, you leave out the fact that macro observables might emerge from the interactions between micro degrees of freedom. Mathematically, Glasner's point is that the representative agent implies the ensemble average of an operator is no different from the single agent expected value, that

⟨Ω|Ô|Ω⟩ ~ ⟨1|Ô|1⟩

where ⟨1|Ô|1⟩ = ⟨2|Ô|2⟩ = ... which obviates the difference between the n-agent macro state |Ω⟩ and the single agent micro states |1⟩, |2⟩, ... and e.g. "unintended consequences" from the interaction between |1⟩ and |2⟩ are left out. Basically, the representative agent approach assumes the macro observable determined by the operator Ô is diagonal. Actually, we can derive the representative agent model from my formulation of Little's definition of microfoundations:

⟨Ω|Ô|Ω⟩ =  Σi⟨Ω|Ô|i⟩⟨i|Ω⟩

⟨Ω|Ô|Ω⟩ =  Σi ⟨i|Ω⟩⟨Ω|Ô|i⟩

[correction] The representative agent model is that the macro states are exactly the same as (identified with [1]) some micro state (the representative agent) so we can change out Ω for some j (the representative agent)

⟨Ω|Ô|Ω⟩ =  Σi ⟨i|j⟩⟨j|Ô|i⟩

⟨Ω|Ô|Ω⟩ =  Σi  δij ⟨j|Ô|i⟩

⟨Ω|Ô|Ω⟩ =  ⟨j|Ô|j⟩

[end correction]

In contrast, the information equilibrium approach can be seen as a different application of my formulation of Little's microfoundations

⟨Ω|Ô|Ω⟩ =  Σi ⟨i|Ω⟩⟨Ω|Ô|i⟩

⟨Ω|Ô|Ω⟩ =  tr |Ω⟩⟨Ω|Ô = tr Ô|Ω⟩⟨Ω| 

⟨Ω|Ô|Ω⟩ =  tr Ô exp(- Â log m)

where I identified the operator |Ω⟩⟨Ω| ≡ exp(-  log m) where Â picks off the information transfer index of a micro market. This is the partition function approach. And we are saying the macro state Ω is directly related to a maximum entropy distribution (partition function):

Z = tr |Ω⟩⟨Ω|

The partition function approach is basically a weighted sum over (Walrasian) micro markets that produces macro observables ... borrowing Glasner's words, we are: "reconciling the macroeconomic analysis derived from Keynes via Hicks and others with the neoclassical microeconomic analysis of general equilibrium derived from Walras."

What about the emergent representative agent? Well, if Â is diagonal in its representation in terms of microstates, then

⟨Ω|Ô|Ω⟩ =  tr Ô exp(- Â log m)

⟨Ω|Ô|Ω⟩ =  Σi ⟨i|Ô exp(- Â log m)|i⟩

⟨Ω|Ô|Ω⟩ =  Σi ⟨i|Ô|i⟩ exp(- ai log m)

If we take m >> 1 (a large economy) the leading term is min {ai} that we'll call a₀ so that

⟨Ω|Ô|Ω⟩ ≈ ⟨0|Ô|0⟩ exp(- a₀ log m)

⟨Ω|Ô|Ω⟩ ~ ⟨0|Ô|0⟩

This has the analogy of the ground state (at zero temperature) in physical system [3].

...

Footnotes:

[1] For example, as Glasner says, "the business cycle is not the product of the interaction of individual agents, but is simply the optimal plan of a representative agent"

[2] As an aside, the idea of having consumers and firms seems like a strange basis that isn't necessarily complete (and actually includes two different levels as firms are made of consumers).

[3] For bosons, this would be a Bose-Einstein condensate. So the representative agent is like a bunch of molecules in the same state behaving as a single entity.

Prediction aggregation, redux

Here's a new post that aggregates predictions (here is the previous one).

_________________________________

Prediction: multiple indicators

https://informationtransfereconomics.blogspot.com/2015/09/predictions-doing-well-after-18-months.html
https://informationtransfereconomics.blogspot.com/2016/04/celebrate-this-blogs-birthday-with.html
[US core CPI inflation, RGDP, interest rates from 2014 to 2016 = 2 years]
updated 04/2016

Status: Successful

_________________________________

Prediction: interest rates

https://informationtransfereconomics.blogspot.com/2015/08/comparison-of-interest-rate-predictions.html
https://informationtransfereconomics.blogspot.com/2016/05/doing-economists-work-only-better.html
https://informationtransfereconomics.blogspot.com/2016/11/the-surge-in-10-year-rate.html
https://informationtransfereconomics.blogspot.com/2017/02/monetary-base-and-interest-rate.html
https://informationtransfereconomics.blogspot.com/2017/08/who-has-two-thumbs-and-really-great.html
https://informationtransfereconomics.blogspot.com/2017/10/10-year-interest-rate-forecasts-in-us.html
[US long term interest rates from 2015 until 2025 = 10 years]
updated 10/2017

Status: Ongoing


_________________________________
https://informationtransfereconomics.blogspot.com/2015/07/comparing-ngdp-predictions-with-results.html
https://informationtransfereconomics.blogspot.com/2016/01/predictions-and-prediction-markets.html
https://informationtransfereconomics.blogspot.com/2017/01/updating-ngdp-path-prediction.html
https://informationtransfereconomics.blogspot.com/2017/04/update-to-predicted-path-of-ngdp.html
https://informationtransfereconomics.blogspot.com/2018/01/another-successful-forecast-ngdp.html
[US NGDP from 2015 to 2018 = 3 years]
updated 01/2018

Status: Successful

_________________________________

Prediction: Inflation versus DSGE model

http://informationtransfereconomics.blogspot.com/2015/08/latest-pce-inflation-data.html
http://informationtransfereconomics.blogspot.com/2015/10/core-pce-inflation-update.html
http://informationtransfereconomics.blogspot.com/2015/11/speaking-of-math.html
http://informationtransfereconomics.blogspot.com/2016/02/model-forecast-update-core-pce-inflation.html
http://informationtransfereconomics.blogspot.com/2016/04/update-to-2014-it-model-inflation.html
http://informationtransfereconomics.blogspot.com/2016/08/ie-vs-ny-fed-dsge-model-update.html
http://informationtransfereconomics.blogspot.com/2017/01/an-inflation-forecast-comparison-update.html
https://informationtransfereconomics.blogspot.com/2017/11/comparing-my-inflation-forecasts-to-data.html
https://informationtransfereconomics.blogspot.com/2018/01/losing-my-vestigial-monetarism.html[US core PCE inflation; comparison with NY Fed DSGE model]
updated 01/2018

Status: Rejected ☹


_________________________________

Prediction: EU inflation

http://informationtransfereconomics.blogspot.com/2015/09/correctly-predicting-eurozone-lowflation.html
http://informationtransfereconomics.blogspot.com/2016/04/blog-birthday-week-continues-another.html
[EU inflation (HICP) sans energy and seasonal food]
updated 04/2016

Status: Successful

_________________________________

Prediction: PCE inflation versus corridor model

http://informationtransfereconomics.blogspot.com/2014/08/smooth-move.html
http://informationtransfereconomics.blogspot.com/2016/02/model-forecast-update-core-pce-inflation.html
http://informationtransfereconomics.blogspot.com/2016/04/update-to-2014-it-model-inflation.html
[US core PCE inflation, comparison with David Beckworth's corridor model -- to 2020]
updated 04/2016

Status: Ongoing

_________________________________

Prediction: Canadian inflation

http://informationtransfereconomics.blogspot.com/2015/06/celebrating-500-posts-with-predictive.html
http://informationtransfereconomics.blogspot.com/2017/02/worthwhile-canadian-prediction-comes.html
[Canada CPI inflation (undershooting)]
updated 02/2017

Status: Successful


_________________________________

Prediction: Japanese price level

http://informationtransfereconomics.blogspot.com/2015/07/model-prediction-holding-up-for-japan.html
http://informationtransfereconomics.blogspot.com/2016/01/updates-to-some-ongoing-forecasts.html
http://informationtransfereconomics.blogspot.com/2016/01/the-bojs-macroeconomic-experiment.html
http://informationtransfereconomics.blogspot.com/2016/02/it-model-forecast-update-for-japan.html
http://informationtransfereconomics.blogspot.com/2016/08/japan-lack-of-inflation-update.html
[Japan "core-core" price level and inflation to 2020/2025]
updated 08/2016

Status: Ongoing


http://informationtransfereconomics.blogspot.com/2017/03/the-mystery-of-japans-inflation.html
http://informationtransfereconomics.blogspot.com/2017/07/a-few-forecast-updates.html
[Japan "core-core" price level to 2020 with dynamic equilibrium model]
updated 07/2017

Status: Ongoing


_________________________________

Prediction: UK exchange rate

http://informationtransfereconomics.blogspot.com/2015/06/exchange-rates-and-irrational-markets.html
http://informationtransfereconomics.blogspot.com/2016/04/blog-birthday-week-continues-another_29.html
[Euro GBP (€-£) exchange rate]
updated 04/2016

Status: Successful

_________________________________

Prediction: UK inflation

http://informationtransfereconomics.blogspot.com/2015/06/forecasts-from-new-bank-of-england-blog.html
http://informationtransfereconomics.blogspot.com/2016/05/update-of-uk-inflation-prediction.html
[UK CPI, comparison with the Bank of England]
updated 05/2016

Status: Ongoing

_________________________________

Prediction: monetary base/interest rates

http://informationtransfereconomics.blogspot.com/2015/12/zirp-is-over-let-experiment-begin.html
http://informationtransfereconomics.blogspot.com/2016/01/post-hike-monetary-base-projection.html
http://informationtransfereconomics.blogspot.com/2016/01/the-10-year-treasury.html
http://informationtransfereconomics.blogspot.com/2016/02/the-long-and-short-of-interest-rates.html
http://informationtransfereconomics.blogspot.com/2016/03/interest-rate-and-monetary-base-updates.html
http://informationtransfereconomics.blogspot.com/2017/02/monetary-base-and-interest-rate.html
http://informationtransfereconomics.blogspot.com/2017/02/monetary-base-update.html
http://informationtransfereconomics.blogspot.com/2017/07/a-few-forecast-updates.html
[US monetary base]
updated 07/2017

Status: Ongoing

 
_________________________________

Prediction: lag model of CPI inflation

http://informationtransfereconomics.blogspot.com/2015/11/cpi-inflation-predictions-and.html
http://informationtransfereconomics.blogspot.com/2016/01/updates-to-some-ongoing-forecasts.html
[US core CPI and PCE inflation to 2018]
updated 02/2017 (at 11/2015 link)

Status: Rejected (t < 1 year) ☹
Status: Ongoing, (t > 1 year)


_________________________________

Prediction: Swiss CPI 

https://informationtransfereconomics.blogspot.com/2015/01/floating-swiss-franc-wont-change-price.html
https://informationtransfereconomics.blogspot.com/2016/02/another-win-for-it-model-switzerland.html
[Swiss CPI]
updated 02/2016

Status: Successful 

_________________________________

Prediction: US rental vacancies

https://informationtransfereconomics.blogspot.com/2017/04/dynamic-equilibrium-rental-vacancy-rate.html
[US rental vacancies]
updated 4/2017

Status: Ongoing


_________________________________


Let me know if I've forgotten any ...