In the last post I mentioned I wanted to try and look at a way to see model results from different countries on the same graph. Here is the process I went through.
First, I set up the variables
$$
\kappa = \frac{\log Q^s/C_0}{\log Q^d/C_0}
$$$$ \sigma = \frac{Q^s}{Q^s_{ref}} $$
I call these the information transfer index (from the original theory) and the normalized monetary base, respectively. Defining the constant
$$ \alpha = \frac{Q^d_{ref}}{Q^s_{ref}} $$
we can write
$$ P = \alpha \frac{1}{\kappa} \sigma^{1/\kappa-1} $$
.png) I plotted the fits of the data for Japan and the US on the same graph in the $\kappa\sigma$-plane. I also plotted the location of the ridge line in the linked posts, i.e. the place where $\frac{\partial P}{\partial\sigma} = 0$ such that monetary policy has no effect on the price level (I will refer to this as the monetary multiplier being zero). This is the result (on the right: blue is US, brown is Japan and the dashed lines represent the location of the ridge). I noticed how close the ridge lines come to falling right on one
another. The question I had was what if we constrained the equations
(i.e. the fit parameters) such that these lines coincided?
I plotted the fits of the data for Japan and the US on the same graph in the $\kappa\sigma$-plane. I also plotted the location of the ridge line in the linked posts, i.e. the place where $\frac{\partial P}{\partial\sigma} = 0$ such that monetary policy has no effect on the price level (I will refer to this as the monetary multiplier being zero). This is the result (on the right: blue is US, brown is Japan and the dashed lines represent the location of the ridge). I noticed how close the ridge lines come to falling right on one
another. The question I had was what if we constrained the equations
(i.e. the fit parameters) such that these lines coincided?
Calculating the derivative above (after dividing by $\alpha$), one obtains
$$
\frac{\partial P(\kappa,\sigma)}{\partial\sigma} =\frac{\partial}{\partial\sigma}\frac{\log Q^d/C_0}{\log \sigma Q^s_{ref}/C_0} \sigma^{\frac{\log Q^d/C_0}{\log \sigma Q^s_{ref}/C_0}-1} = 0
$$$$ \frac{P(\kappa, \sigma)}{\sigma} \left[ \frac{\log Q^d/C_0}{\log \sigma Q_{\text{ref}}^s/C_0} \left(\frac{\log \sigma }{\log \sigma Q_{\text{ref}}^s/C_0}-1\right)+\log \sigma Q_{\text{ref}}^s/C_0 + 1 \right] = 0 $$
The bracketed term must be zero since the piece outside the bracket is positive, so therefore, after some substitutions
$$
-\frac{1}{\kappa}\log \left(\frac{Q^s_{\text{ref}}}{C_0}\right)+\log \left(\frac{\sigma
Q_{\text{ref}}^s}{C_0}\right)+1=0
$$And we arrive at
$$ \sigma = \frac{C_0}{ Q_{\text{ref}}^s} \exp \left( -\frac{\kappa + \log \frac{C_0}{ Q_{\text{ref}}^s}}{\kappa} \right) $$
Note that this function is only of $\sigma$, $\kappa$ and $C_0/Q_{\text{ref}}^s \equiv \gamma$. This means if I use the parameters for the US to find $\gamma$, I can then constrain the subsequent fits for Japan (and other countries) to maintain $C_0 = \gamma Q_{\text{ref}}^s$ (reducing one degree of freedom). This constrains the fits so that the ridge lines coincide.
I used the US data to fix $\gamma$ and
then fit data for the EU, Japan, Mexico and Indonesia to the two
parameters $\alpha$ and $Q_{\text{ref}}^s$. The former parameter is only
an overall normalization that depends on the reference year for the
price level, so once $\gamma$ is fixed, all subsequent fits are
effectively one-parameter fits. Here are the graphs of the fits to the
price level:
.png)
The next graph shows the final "universal" results with all of the
countries in the same $\kappa\sigma$-plane along with the location of
the ridge line (dashed curve, monetary multiplier = 0):
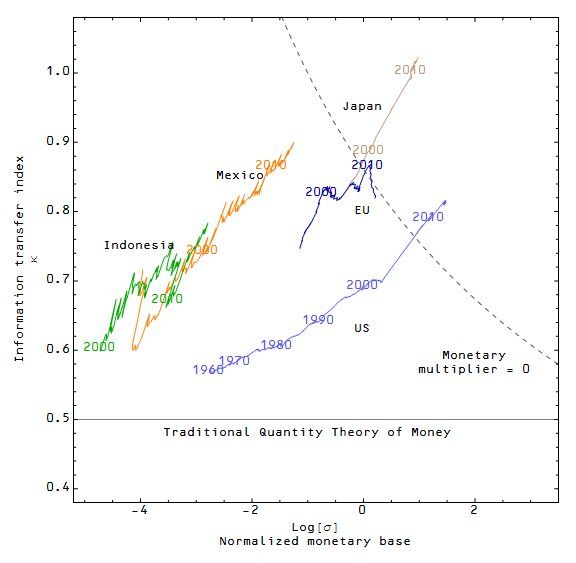
Some notes:
- This is really cool if I do say so myself.
- It looks like the US, Japan and the EU have entered the space where monetary policy is ineffective (or has the opposite of the intended effect).
- Mexico has recently entered into a period of relative stagnation that may correlate with the country nearing the multiplier = 0 line.
- The traditional quantity theory of money, which I define as the inflation rate being equal to the growth rate of the monetary base, applies when $\kappa = 1/2$, shown on the graph.
- All the data is from the FRED data base, using M1, Nominal GDP and the GDP deflator (except the EU data which uses the Euro Area CPI, less food and energy). The US data uses the Adjusted monetary base and the US CPI.
"This is really cool if I do say so myself. "
ReplyDeleteI agree. :D