Sunday, January 31, 2016

The BoJ's macroeconomic experiment

Via Frances Coppola, we have the BoJ forecasts for CPI inflation through 2017, including the effect of the new "negative interest rate". First, we shouldn't forget this in assessing central banks' capabilities in this regard. For the IT model forecast for Japan, see here.

However, it looks like the BoJ isn't predicting anything too far outside the IT model range. Recall the IT model does as well as is possible on these medium range forecasts assuming month to month fluctuations are mostly measurement error (I called it irreducible measurement error here). I show the model prediction along with 2σ (95%) errors for annual core CPI inflation.


Also, according to the quantity theory of labor, Japan would have to have higher labor force growth to get 2% inflation.

Here's the original graph from the BoJ's report from 30 Jan 2016:


What is and isn't economics?


It's probably hubris for a physicist to say what is or isn't economics, but I'll have a go anyway. My last post was about how it appears that technology and government don't have first order effects on the macroeconomy. In response, Commenter Jamie said something very interesting:
That suggests to me that there is a serious mismatch between interesting economic questions and current macroeconomic techniques.
Here is part of my reply:
Indulge me in a paraphrase: 
"That suggests to me that there is a serious mismatch between interesting scientific questions (species adaptation, life in the universe) and current physics techniques." 
At one time, some physicists did have some contributions to biology (e.g. Schrodinger's What is Life?), but really since the beginning physics techniques were never matched up with scientific questions from biology. Hence they are different fields. 
In my view, the subjective impact of technology on our lives is the domain of sociology anthropology, and history. It's economic impact can vary from nil to huge. 
Another analogy: in some cases, the biosphere has limited impact on our understanding of geology (volcanism, plate tectonics); in others it is huge (carbon and water cycles, oxygenated atmosphere). But in general, you shouldn't start to try to answer a geological question with biology. Start with plate tectonics, glaciation and sea level changes. 
Sure, it is possible that the biosphere can cause things to happen that lead to those glaciation events or global warming (I wouldn't even discount the hypothesis that biological processes could help lubricate plate tectonics). And biology may be critical to the coefficients in those effective geological processes (biology determines the composition of the atmosphere, for example). You could say: it's all atoms, so atoms have to be important. But that importance shows up as e.g. the triple point temperature of water ... once you have that (even empirically) you don't need quantum chemistry to understand geology. You don't need to know the specific ecological niche of coccolithophores (or other biological details) to understand the cliffs of Dover; you just need three: that they live in the water, their abundance and that they have shells of calcium carbonate.

One thing to keep in mind is this: If social and psychological effects (properties of agents) are integral, then we should probably give up on economics because it becomes a multi-million dimensional agent problem and therefore intractable. If you think there is a real thing called "the macroeconomy", "the market" or "social welfare" (or "representative agents" or "inequality"), then you're already headed down the path of dimensional reduction -- and it becomes only a question of how far. The macroeconomy can't simultaneously be a complex nonlinear system critically dependent on its constituent agents and something with comprehensible aggregate properties. 

With that in mind, I thought I'd make a handy list (that might grow, shrink or change) for how the information transfer framework sees the field of economics:
  • Quality of life: This is largely a question for politics, psychology, sociology and history. How we subjectively experience the world around us seems to only loosely correlate with money, and even in that case it's only poverty is the proximate cause to low quality of life. Because of our system, some people can't afford basic needs. If basic needs were directly provisioned by the government, then I suspect the correlation between quality of life and money would fall precipitously. Another way: it is a failure of the market allocation mechanism to match up the market allocation with social welfare. However, that has little bearing on how the market allocation algorithm works. Conclusion: not economics.
  • Economic growth: There are a couple of information equilibrium models where economic growth seems to flow from macro aggregates of "widgets" (labor supply or money supply), so long run economic growth seems to be about the allocation problem, not about society, history or culture. Causation might actually go the other way with economic growth (or lack of it, or lack of equal gains among segments of society) leading to political cohesion, unrest, revolution and warfare. Functioning markets that lead to economic growth need to be set up by governments (or general social trust), but once operational, these impacts likely enter though coefficients (e.g. higher information transfer indices in countries with more "trust"). Social effects are probably second order effects on the coefficients rather than terms in the model. Conclusion: economics.
  • Recessions: Not well understood. Possibly an interesting interaction between group psychology/sociology and macroeconomics via financial markets. The information transfer framework can model recessions as non-ideal information transfer (market failure), or falls in entropy (coordination of agents). It could also just be avalanches set up by a "snow pack" of macro aggregates (via the central bank) and triggered by financial crises and or the central bank. In general, recessions happen in a background of an information equilibrium solution -- you need to understand that first to know how recessions work. Conclusion: maybe economics.
  • Inflation: This doesn't appear to be independent of economic growth, but rather just another measure of the same thing. In most information equilibrium models with good empirical results we have nominal output N ~ k log X and price level P ~ (k - 1) log X where X is some macro aggregate like labor supply or money supply. So P isn't really independent of N. Hyperinflation, though it can be tackled by the information equilibrium model, is probably more a socio-political/psychological problem. In a sense, when inflation stops being well-described by an information equilibrium model, it's probably a political problem. It might be connected to pegged interest ratesConclusion: economics.
  • Technology: Some aspects of technology lead to impacts on macro aggregates (like public health on the labor supply) that leads to growth. Other technologies are nothing more than additional widgets where the identity of the widgets doesn't matter to the economic allocation problem. Communication advances probably lead to a speeding up of the exploration of the economic state space (as well as speeding up and increasing the size of deleterious coordinations like mass panics). The technologies that are just widgets are best left to sociology, anthropology and history. The measures of technology in economics might just measure economic entropyConclusion: generally not economics.
  • Government (institutions): My view is that government basically can act as a "helpful coordination", convincing people not to panic, encouraging them to not give into the paradox of thrift, or employ people directly during a recession to mitigate its effects. Central banks can help in this process, or set off deleterious coordinations. At some level government printing of money, warfare and debt can have a role. However, it appears that isn't economics per se and is politics, sociology or history (see inflation, above). And politics can be a powerful force. In the 1960s and 70s, the US allowed women and African Americans to become part of the labor force -- which may be behind the so-called "great inflation" at the timeConclusion: aggregate is economics; otherwise not economics.
  • Financial markets: The main economic effects are either as responses or triggers. The could fall in response to a macro avalanche (above) or trigger one. They could also respond to or trigger coordinated group behavior leading to a loss in economic entropy (equal to nominal output) -- or even non-ideal information transfer. Conclusion: aggregate is economics; otherwise not economics.
  • Money: Possibly just another widget, but may be a good indicator widget like the famous "Big Mac index". It could also be what allows agents to explore economic state space and therefore the source of entropy. These two views would find themselves at home in the quantity theory of labor (P : PY ⇄ CLF) and the monetary information transfer model (P : PY ⇄ M0), respectively. It does appear to be directly related to interest rates. Conclusion: economics.

Friday, January 29, 2016

False dichotomy (as in: both choices are false)


John Cochrane gives us a false dichotomy on slower growth:
I still suspect that slow growth is resulting from government-induced sclerosis rather than an absence of good ideas in a smoothly functioning economy.
Those really aren't the only two choices, and in fact those effects seem to be based on small effects rather than large ones. In a sense, it is like saying the energy levels of Hydrogen are mostly due to the Lamb shift rather than Coulomb's law. Let me explain. First, technology.

There are major inventions that have completely changed our lives, yet don't seem to have impacted economic growth. For example, there is the famous saying that computers (or the internet) show up everywhere except productivity. My job is entirely different from what it would have been 20 years ago. Even in the past 10 years, I've gone from needing supercomputers to doing the same work with a laptop (with the right GPU). But Robert Gordon (whom Cochrane is objecting to) doesn't think computers are important. From Krugman's review of Gordon's book:
Developments in information and communication technology, [Gordon] has insisted, just don’t measure up to past achievements. Specifically, he has argued that the I.T. revolution is less important than any one of the five Great Inventions that powered economic growth from 1870 to 1970: electricity, urban sanitation, chemicals and pharmaceuticals, the internal combustion engine and modern communication.
Gordon seems to have post hoc definitions of when inventions are great -- the ones that came before periods of high growth -- that renders the technology explanation circular. If computers and networking aren't the kind of inventions that lead to major growth, then there is something seriously wrong with the theory. 

And how these inventions lead to growth depends critically on your theory of growth. Sure productivity could be enhanced by urban sanitation (increased real output per person because people are sick less often). But urban sanitation would be critically important in my quantity theory of labor [1] where urban sanitation leads to simply more people (fewer dying). Electricity doesn't actually increase the quantity of labor like sanitation does in the QTL, but rather adds hours in the evening for some kinds of work -- likely a second order effect. 

In contrast, urban sanitation would have no direct effect in the monetary information equilibrium model where slow growth seems to arise as an entropic force (see here or the paper [2]). A large economy simply has more ways that it can be realized in terms of many slowly growth markets than a few high growth markets making the former simply the more likely state -- regardless of what products or technology exist in the economy.

Now, what about government?

The US federal government increased its size (measured in money) relative to the economy (measured in money) gradually from about the 1930s to about the 1970s (with the exception of WWII). Any person with even a modicum of math skills would see that:

NGDP(G) = NGDP(0) + c₁ (G/NGDP(0)) + c₂ (G/NGDP(0))² + ...

With G/NGDP ~ 0.2 and natural coefficients, that means it could be at most a 25% effect, not an order 1 effect. And it started as a 5% effect prior to the 1930s. Ok, so we have a scale for the effect of government as a fraction of the economy. What now?

Well, as Gordon mentions the 1970s were the end of the period of rapid growth -- meaning that growth slowed when the scale of government impact on the economy stopped growing. And since then, growth has gradually declined even when the government remained about the same size relative to the economy. So at the aggregate macro (dimensionally reduced) level, there is no obvious direct effect.

Yes, this is a back of the envelope calculation. But it means any negative impact from government would have to be unnatural (the c's are large or small or both), highly nonlinear, and/or depend critically on a serious lack of dimensional reduction in aggregating agent behavior. True to form, Cochrane does think there is a serious lack of dimensional reduction (he suggests various microeconomic policies that he thinks integrate into a macroeconomic effect). So at least he is consistent. 

But no one has ever shown this happens. No agent model has ever been aggregated and produced empirically accurate results that depended on agent micro parameters. As I've said before, if dimensional reduction doesn't occur, then economics is probably computationally intractable. And I think there is strong evidence that dimensional reduction does occur -- if only because the models [1] and [2] do pretty well with huge amounts of dimensional reduction.

Speaking of [1] and [2], neither have first order impacts from the government, and second order (at the aggregated macro scale) impacts (from immigration and equal rights/gender equality in [1] and the size of the government and/or financial sector in [2]).

So neither government nor technology seem like the the most plausible mechanisms to describe the steady decline in US growth. At least not without proposing very tedious and complex models that have no hope of being empirically rejected ... because macro data is uninformative for such tedious and complex models.

...

Update

Additional thoughts on this subject from Noah Smith. And he really gets at a good point. If we want to know how much technology has improved our lives (or government bureaucracy has made things annoying or difficult in business or our personal lives), then we should look at that subjectively. You can tell histories, but leave out the math.

I said before (paraphrasing): the greatest trick economists ever pulled was that NGDP is about our well-being. It's not. Money is an allocation algorithm, full stop and we could reach the current US NGDP without ever developing any technology.

Update, the second (30 Jan 2016)

Dietrich Vollrath as a good blog post up about the persistence of technology. Basically, all of the inventions you had at one time (1500 AD, in this case) is fairly predictive of future growth. The identity of the inventions don't matter for this prediction. But think about what else that means: all of the inventions between the 1500s and the 2000s don't matter to the prediction either. As Vollrath puts it:
In that sense, it isn't the technology in 1500AD per se that matters in the CEG regressions, this is an indicator of some kind of variation in culture or institutions (or something else?) that matters. To return to the earlier discussion, it seems likely that their results won't ultimately turn out to be causal, but the predictive power is telling us to something about how powerful those cultural/institutional [Ed.: or something else?] factors are.
I added the second something else (Vollrath included it in the first sentence, so felt it was appropriate). Maybe more inventions is a sign of a higher entropy economy? More dither?

I also changed the sentence above from "First, growth." to "First, technology." because that is what I meant.

Predictions and prediction markets

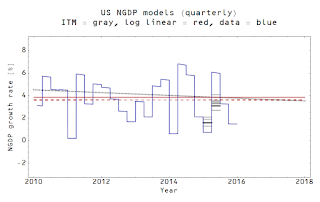
The 1st estimate of 2015 Q4 NGDP data is available on FRED today. It appears Hypermind has removed its NGDP predictions before I had a chance to update them in the graph (and Scott Sumner has removed it from his blog's front page). So all I have to go with is the data I had when I made the graph back in July after Q2 results. Here are the updated graphs, now with annual and quarterly predictions/data separated (last Hypermind predictions are in black, previous in grays):


The prediction markets result for 2015 growth is basically indistinguishable from a log-linear extrapolation of data (shown as red dashed lines) from after 2009. The ITM (gray dashed curves) was almost exactly right, but I wouldn't read too much into that since it's not terribly different from the log-linear extrapolations (all time: solid red, since 2009: dashed red) itself.

Hypermind's blog doesn't mention the NGDP markets except generically mentioning macroeconomics: "All the predictions so far have been about politics, geopolitics, macroeconomics, business issues, and some current events." They do show a funny plot that I've seen in the research before:


The information transfer view predicts this sort of result from purely random behavior as I show in this blog post from last October:
Corporate prediction markets aggregate random behavior
The data is closer to the line in the Hypermind case simply because there were more markets and measurements, making the ideal information transfer picture a better approximation. 

Nominal shocks in the presence of growth

I updated graphs here (originally from here) to show what happens to the price level and nominal output during a shock in the presence of growth (first is nominal output, second is the price level, both showing ideal and non-ideal information transfer):


Thursday, January 28, 2016

Post-hike monetary base projection

There's some new monetary base data out today (and there will be NGDP data out tomorrow, so stay tuned).

If a) the information equilibrium model is right, b) there are no interest rate changes in the interim, and c) we can assume a similar rate of decline as there was a rise in the monetary base (a symmetric rise and fall), here is its expected path (with projected 1-sigma error):


The final level of about 2.6 trillion dollars is depicted as flat because I'm feeling lazy. It actually increases a bit over time because of NGDP growth (see link at top of post).

This is probably a sucky prediction anyway since there are only about 6 data points from after the rate hike and the noise (error) has been growing over time. The symmetry argument is doing quite a bit of work here.

Just a reminder: the information equilibrium model does not predict the rate of approach to equilibrium. It's analogous to the ideal gas law: if you shock the system (rapidly expand the gas), the path of pressure isn't predicted by the equilibrium ideal gas law unless equilibrium is maintained at each point along it. Typically, this is done by very good thermal contact with a heat bath. However, a given quantity of heat takes a finite time to move from the bath into the expanding gas, so if the expansion is fast relative to that heat diffusion time the gas will get a bit cold. In that case, the pressure will be lower than Boyle's law states for an isothermal expansion. But eventually everything should return to equilibrium, and in the final state Boyle's law will hold.

Wednesday, January 27, 2016

Models and frameworks

Given that I recently put forward the idea that inflation and growth are all about labor force growth, I thought I'd clarify some things. Some of you might have asked yourself (or did ask me in comments) about how this "new model" [1] relates to the "old model" [2] that's all about money. I know I did.

The key thing to understand is that the information transfer framework (described in more detail in my arXiv paper) is just that: a framework. It isn't a model itself, just a tool to build models. Those models don't have to be consistent with each other. So there really is no "new model" or "old model", just different models that may be different approximations (or one or both might become empirically invalid as more data comes in).

And as a tool, it's basically an information-theoretic realization of Marshallian supply and demand diagrams. What you do is posit an information equilibrium relationship between A and B, which I write A ⇄ B, or an information equilibrium relationship with an abstract price p = dA/dB, which I write p : A ⇄ B, and here's what's included (act now!) ...

  • A general equilibrium relationship between A and B (with price p) where A and B vary together (that always applies). Generally, more A or more B leads to more B or more A, respectively.
  • A partial equilibrium supply and demand relationship between A and B (with price p) with B being supply and A being demand -- it applies when either A or B is considered to move slowly with respect to the other (it's an approximation to the former where A or B is held constant).
  • The possibility of "market failure" where we have non-ideal information transfer that I write A  → B (all of the information from A doesn't make it to B). This leads to a non-ideal price p* < p as well as a non-ideal supply B* < B.
  • A maximum entropy principle that describes what (information) equilibrium between A and B actually means, including a causality that can go in both directions along with potentially emergent entropic forces that have no formulation in terms of agents.

So in the information transfer framework there are information equilibrium relationships A ⇄ B and more general information transfer relationships A  → B. I tend to refer to these individual relationships as "markets". Given these basic "units of model", you can construct all kinds of relationships. Traditionally crossing-diagrams are easiest. Things like the AD-AS model or the IS-LM model can be concisely written as the market

P : AD ⇄ AS

where AD is aggregate demand and AS is aggregate supply, or the markets

(r ⇄ p) : I ⇄ M

PY ⇄ I

PY ⇄ AS

for the IS-LM model where PY is nominal output (i.e. P × Y = NGDP, I also tend to write it N on this blog and in the paper), I is investment, M is the "money supply", p is the "price of money" and r is the interest rate.

Another aspect of the model is that information equilibrium is an equivalence relation, so that AD ⇄ M and M ⇄ AS implies AD ⇄ AS (this makes an interesting definition of money). This means that if you find a relationship (as I did in [2])

CPI : NGDP ⇄ CLF

there could be some other factor(s) X (, Y, Z, ...) such that

NGDP ⇄ X ⇄ Y ⇄ Z ⇄ CLF

Relationships like this can be inferred from a price that doesn't follow CPI* < CPI, but can be above or below the ideal price CPI (CPI* < CPI or CPI* > CPI) that follows from being careful about the direction of information flow and the intermediate abstract prices p₁ and p₂ in the markets

p₁ : NGDP ⇄ X
p₂ : X ⇄ CLF

These would probably find their best analogy in "supply shocks" (price spikes due to non-ideal information transfer) as opposed to "demand shocks" (price falls due to non-ideal information transfer). Note that in the model CPI : NGDP ⇄ CLF with intermediate X,  CPI = p₁ × p₂ because CPI = dNGDP/dCLF = (dNGDP/dX) (dX/dCLF) via the chain rule.

In the end, however, the only way to distinguish among different information equilibrium models (or information transfer models) is empirically. This framework works much like how quantum field theory works as a framework (as a physicist, I like to have a framework ... anything else is just philosophy). You observe something in an experiment and want to describe it. One group of researchers models it as a real scalar field and writes down a Lagrangian

ℒ = ϕ (∂² – m) ϕ

Another group models it as a spin-1/2 field

ℒ = ψ (i ∂ – m) ψ

(ok, that one's missing a slash and a bar). Both "theories" are perfectly acceptable ex ante, but ex post one or both may be incompatible with empirical data.

Actually one of the goals of this blog (and the information transfer model) was to introduce exactly this kind of model rejection to economics:
I was inspired to do this because of Noah Smith's recent post on why macroeconomics doesn't seem to work very well. Put simply: there is limited empirical information to choose between alternatives. My plan is to produce an economic framework that captures at least a rich subset of the phenomena in a sufficiently rigorous way that it could be used to eliminate alternatives.
I've come up with several different information equilibrium relationships -- or models built from collections of relationships (see below) -- and I am testing their abilities with forecasts. Some might fail. Some have failed already. For example, the IS-LM model does not work if inflation is high (but represents an implicit assumption that inflation is low, so it is best to think of it as an approximation in the case of low inflation). A few of Scott Sumner's versions of his "market monetarist" model can be written as information equilibrium relationships (see below) ... and they mostly fail.

In a sense, I wanted to try to get away from the typical econoblogosphere (and sometimes even academic economics) BS where someone says "X depends on Y" and someone else (such as myself) would say "that doesn't work empirically in magnitude and/or direction over time" and that someone would come back with other factors A, B and C that are involved at different times. I wanted a world where someone asks: is X ⇄ Y? And then looks at the data and says yes or no. DSGE almost passes this test -- these models are at least specific enough to compare to data. However they don't ever seem to look at the data and say no ... it's always "add a financial sector" or "add behavioral economics". There isn't enough data to support that kind of elaboration.

A good example is the quantity theory of money. It says PY = MV. Now this was great in a world where people thought V was constant (i.e. the old Cambridge k). But that turns out not to be the case and now V could depend on E[PY] or E[P] or E[M] or something else. What are these specific expectation models? Is E[P] = TIPS? Or is V ≡ PY/M is now a definition? And what is M? M2? MB?

Essentially various versions of the quantity theory of money have been falsified empirically (or at best a loose approximation when inflation is high) ... but it keeps trucking along because it doesn't exist in a framework where either its scope or validity can be challenged.

It's probably a naive hope, but it's the kind of naive hope that distinguishes "science" from "mathematical philosophy".

...

Addendum: information equilibrium models

Note that just because these models can be formulated does not mean they are correct.

I. The "quantity theory of labor" [1]

P : PY ⇄ CLF

See this post for this one.

II. "The" IT model [2]

P : PY ⇄ M0
(r¹⁰ʸ ⇄ pᴹ⁰) : PY ⇄ M0
(r³ᵐ ⇄ pᴹᴮ) : PY ⇄ MB
P : PY ⇄ L

where the r's represent the long and short term interest rates (3 month and 10 year), M0 is base minus reserves, MB is the monetary base (including reserves) and L is the labor supply (the last relationship is essentially Okun's law). I usually measure the price level P with core PCE, but empirically it is hard to tell the difference between core PCE and core CPI (or the deflator). This model also allows the information transfer index in the first market to slowly vary. This represents a kind of analytic continuation from a "quantity theory of money" to an "IS-LM model with liquidity trap".


Both this model and the next one are in my paper.

III. Solow model (plus IS-LM)

PY ⇄ L
PY ⇄ K ⇄ I
K ⇄ D
1/s : PY ⇄ I
(r³ᵐ ⇄ p) : I ⇄ MB

where the last market is the IS-LM piece, K is capital and D is depreciation. This is a bit different from the traditional Solow model in that it is written in terms of nominal quantities. This may sound problematic, but it throws out total factor productivity as unnecessary and is remarkably empirically accurate in describing output as well as the short term interest rate.

IV. Scott Sumner's various models (1), (2) and (3)

1) u : NGDP ⇄ W/H

... this is just empirically wrong over more than a few years. H is total hours worked and W is total nominal wages.

2) (W/H)/(PY/L) ⇄ u

... but  H/L ⇄ u has almost no content (higher unemployment means fewer worked hours per person) and the relationship c : PY ⇄ W has a constant abstract price meaning  PY = c W with c constant. The model reduces to (1/c) (H/L) ⇄ u or just the content-less H/L ⇄ u.

The correct version of both of these is P : PY ⇄ L or P : PY ⇄ H, which are just Okun's law (above).

3) (1/P) : M/P ⇄ M

This may look a bit weird, but it could potentially work if Sumner didn't insist on an information transfer index  k = 1 (if k is not 1, that opens the door to a liquidity trap, however). As it is, it predicts that the price level is constant in general equilibrium and unexpected growth shocks are deflationary in the short run.

Monday, January 25, 2016

It's people. The economy is made out of people.

The question of what exactly economic growth is, and how it works, has been around for awhile. It continues to this day -- for example in Paul Krugman's review from today of Robert Gordon's The Rise and Fall of American Growth, we have a technology story:
Gordon [declares] that the kind of rapid economic growth we still consider our due, and expect to continue forever, was  in fact a one-time-only event. First came the Great Inventions, almost all dating from the late 19th century. Then came refinement and exploitation of those inventions — a process that took  time, and exerted its peak effect on economic growth between 1920 and 1970.
This is part of a technology advancement view of economic growth that's been around since the dawn of modern economics (after the theories of "having all the gold" and "having all the productive land" went nowhere). Today the largest component of economic growth is captured in a measure called total factor productivity often attributed to "technology". Real business cycle theory even attributed the business cycle to "technology shocks".

One probable reason for this theory's persistence is that economic growth itself (at least as we view it today) seems to start in the 1700s with the industrial revolution. Interestingly, this is also when central banks got their start ... along with various quantity theories of money (as opposed to the "quantity theories of technology" above).

Last Friday, I put together a simple, yet empirically effective model of inflation that were the beginnings of what could be called a "quantity theory of labor". I'd like to put forward the idea that maybe economic growth in the long run has nothing to do with money or technology. Instead it is all about information equilibrium (see my paper) between nominal output and the labor force.

Let's start with the information equilibrium relationship

CPI : NGDP ⇄ CLF

where CPI is core CPI, NGDP is nominal output and CLF is the civilian labor force. In information equilibrium, we can solve the information equilibrium differential equation (which the previous notation stands for) in general equilibrium to obtain:

NGDP = n (CLF/c)ᵏ

CPI = (n/c) k (CLF/c)ᵏ⁻¹

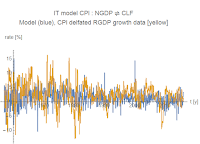
with n and c being constants and k being the information transfer index. How well does this work empirically? Very well -- for such a simple model. I show nominal output, nominal growth and the inflation rate:


The yellow curves are data and the blue curves are the model above. I fit the parameters to both equations simultaneously, resulting in an IT index k ≈ 4.0. One way to interpret this geometrically is that if the CLF is the radius of a 4-sphere, NGDP is proportional to its 4-volume and CPI is proportional to the 3-volume of its surface.

How do we get business cycle fluctuations in this model?

One way would be with a "sunspot" model, potentially with the central bank acting as Roger Farmer's Mr. W (the coordinating source of "sunspots") in his paper [pdf] Global Sunspots and Asset Prices in a Monetary Economy:
What coordinates beliefs on a sunspot equilibrium? Suppose that Mr. A and Mr. B believe the writing of an influential financial journalist, Mr. W. Mr. W writes a weekly column for the fictitious Lombard Street Journal and his writing is known to be an uncannily accurate prediction of asset prices. Mr. W only ever writes two types of article; one of them, his optimistic piece, has historically been associated with a 10% increase in the price of trees. His second, pessimistic piece, is always associated with a 10% fall in the price of trees. 
Mr. A and Mr. B are both aware that Mr. W makes accurate predictions and, wishing to insure against wealth fluctuations, they use the articles of Mr. W to write a contract. In the event that Mr. W writes an optimistic piece, Mr. A agrees, in advance, that he will transfer wealth to Mr. B. In the event that Mr. W writes a pessimistic piece, the transfer is in the other direction. These contracts have the effect of ensuring that Mr. W’s predictions are self-fulfilling.
In the model in this post, the Fed would occasionally give pessimistic forecasts, leading to downturns. However I'd propose a more agnostic view of spontaneous coordination in open markets leading to non-ideal information transfer. If information transfer is non-ideal, we can only put bounds on the macro variables:

NGDP > n (CLF/c)ᵏ

CPI < (n/c) k (CLF/c)ᵏ⁻¹

We'd have a fall in CLF from non-ideal information transfer, which would lead to a fall in nominal output. This leads to a temporary shock to the price level. Here's an animation (I plan on updating this later [update: updated] to show it in the presence of economic growth) where D (aggregate demand) represents NGDP and S represents CLF (labor supply):


There are some pretty wild implications of this model. It means the Fed has little control of the economy (except to potentially crash it). It means monetary theories aren't necessarily causal in the traditional sense. They could have something to do with non-ideal information transfer -- the mechanism of market failure -- but during "normal times" monetary policy is irrelevant. It means "Keynesian" theories work inasmuch as they increase the size of the labor force; other mechanisms of fiscal stimulus (e.g. via inflation) are irrelevant. It's also interesting that even people without jobs but still considered "in the labor force" are important. And if this were a Solow model, we'd have labor with an exponent of 4 and capital with an exponent of 0 (and increasing returns to scale).

It also means Gordon's story of technological innovation above is irrelevant except through ways that technology allow more people to be a part of the labor force. But the biggest factors impacting the labor force in the time period Gordon references was the entry of women and African Americans -- social and political factors, not technological. The economic boom associated with the industrial revolution would have been about people leaving subsistence farming for industrial labor force. A similar story probably applies to China.

It's true this is an incredibly simplistic view of an economy -- it's made out of people. But maybe we should take something incredibly simple like this to be a starting point for macroeconomic study?

...

PS This doesn't mean income/nominal output is allocated proportionally to each member of the labor force. In fact, it would probably have some kind of maximum entropy distribution with a constrained value of < log w > where w is income -- a Pareto distribution -- unless government redistributive policies intervened.

...

Update 27 January 2016

I was asked for a graph of (CPI deflated) RGDP growth using this model. I have provided both a comparison with NGDP/CPI as well as the RGDP growth data directly from FRED (deflated via the GDP deflator). Neither seem to do very well -- the issue is essentially the compounding of model and measurement error from the CPI data and the NGDP data. The average RGDP growth rate from the model is systematically low. The fit objective function above was chosen to minimize the difference between the models and the NGDP and CPI level data, and a different objective function could be chosen to optimize all three level measures, or optimize all three rate measures.


Sunday, January 24, 2016

The pinball theory of value

Points used to be worth more! Source.
Via here I was linked to Brad DeLong's old deep-dive into the fever swamps of Austrian economics and general goldbug-ism which concludes:
Thus I interpret [Austrian economics] as the survival at a prelogical level of a deep attachment to a cost-of-production theory of value, whereby it is the sin of the Mammon of Unrighteousness for anything that can be produced as cheaply as fiat money is to actually have value, and that sin must bring fearful retribution from the Gods of the Market.
I think this is both hilarious and really captures some people's view of money: I did or made something of value and received this worthless green paper in return that no one labored to make?

Actually, I think a pinball analogy is good here. In the days of electro-mechanical scoreboards (pictured above), there at least was some labor going into registering your points you got in return for hitting that ramp. But as games shifted to easily produced electronic numbers, there was massive point inflation.

However -- despite how many billionaires would like it to be so -- money isn't points. That basic idea confuses what money does. Points put a rank-orderable value on your "labor" going into the flippers. But you don't compare scores on different machines. Does a low level executive at Walmart really do as much good as a doctor where both make about the same amount of money? Does a doctor in the US do much more good than a doctor in ... well, just about every other country on earth? 

Not really. Or at least not in any objective way.

That's because money is an algorithm for solving an allocation problem. And there are two issues with the solution it finds:

  1. The allocation problem is so complex that there is no way of telling whether the market allocation is optimal or not, regardless of your (subjective) objective function [1].
  2. The market tends to find maximum entropy allocations [2] ... which tend to be a result of randomness in other systems.

So unlike pinball where high scores (on the same machine) can be used to rank-order players based on their own efforts, it is unknown if people with lots of money represent an optimal allocation [3] or if they got there through their own effort. In fact, there are lots of reasons to believe neither is true -- just look at the research on CEO pay and on inequality.

That's why your labor can be translated into fiat currency. That currency stands for a particular solution to the allocation problem, not an objective value for your labor.

And that's why we can live in a society where fiat currency has no intrinsic value -- and potentially manipulate its supply (price) to mitigate macroeconomic fluctuations.


...

Footnotes

[1] I got this from Cosma Shalizi, and I talk more about this and the market allocation problem (versus the market information problem) here
[2] Actually, the market tends to find maximum entropy allocations that are constrained by the average value of < log x > ... Pareto distributions.
[3] Brad DeLong has a good discussion on the market's social welfare function (here or here [pdf])

Economists should start calling them approximations

Dani Rodrik has put out a set of commandments (for economists and non-economists); I won't discuss them all, but one from each category made me think. I couldn't find a text copy, but a graphic was posted on twitter.

Here are the two (econ and non-econ, respectively):
4. Unrealistic assumptions are OK; unrealistic critical assumptions are not OK.

2. Do not criticize an economist's model because of its assumptions; ask how the results would change if certain problematic assumptions were more realistic.
In a sense, these are two sides of the same coin. Number 2 is how you'd go about determining if an assumption was critical in number 4. Though they have their own internal logic, I have a problem with how they are phrased. However, if I rephrase these with approximation in place of assumption, I'd actually have only a small problem with it (that I'll discuss more below). We'd have:
4. Unrealistic approximations are OK; unrealistic critical approximations are not OK.

2. Do not criticize an economist's model because of its approximations; ask how the results would change if certain problematic approximations were more realistic.

What is the difference between assumption and approximation?
assumption: something taken for granted; a supposition
approximation: a result that is not necessarily exact, but is within the limits of accuracy required for a given purpose.

The latter definition is really what economists like Dani Rodrik are going for. It's what's behind chemists' zero-volume atoms and physicists' frictionless planes. To describe an ideal gas, you don't need to know the volume of an atom or molecule to a first approximation.

But here is where I come to the small problem. The reason we know we don't need to know the volume of atoms in an ideal gas is that the ideal gas equation is empirically valid when the thermal wavelength of atoms is small relative to the density. We can make the unrealistic "assumption" of atoms being 0-dimensional points because we tested it and it worked.

In economics, we don't have a lot of empirically accurate theories [1] -- regardless of their "assumptions". Since macroeconomic data is uninformative, only the simplest macroeconomic models have any chance of being empirically accurate without over-fitting. This could be the reason that economists use the word assumption instead of approximation -- there are no positive results of empirical tests of how good approximations are ... so they really are just assumptions.

Which means that although economists may know how the theoretical results would change (in number 2, above), they have no strong empirical case for whether their approximation is necessary or not. I would probably rephrase number 2 as: Do not criticize an economist's model because of its approximations; criticize them for a lack of even order of magnitude empirical accuracy.

This is not to say everything economists do is wrong. Far from it. For example, on this blog I've tried to show how the unrealistic assumption of H. economicus can arise as a good approximation from irrational individual agents (as long as they don't coordinate e.g. in a panic). And a lot of crossing diagrams and simple macroeconomic models follow from the approximation that random draws from the distribution of supply and random draws from the distribution of demand reveal the same amount of information (in my preprint).

...

Update

Noah Smith has a new review of Rodrik's book up on his blog that is relevant. I added a comment:
There seems to be a tension between:
In doing so, [Rodrik] basically says "The evidence shows that norms often matter, and economists pay attention to the evidence." This demonstrates Rodrik's deep respect for data and evidence.
And this: 
[Rodrik] says that economics, unlike science, doesn't replace bad models with better ones - it just makes new models, expanding the menu of models that policy advisors have to choose from. That seems very true in practice. You rarely hear economists talk about models being "disproven", "falsified", or "rejected".
Paying attention to evidence to add to models (or make new ones) is important, but so is using evidence to reject models. It's my opinion, but you need both to truly respect the data. 
It is related to Noah's refrain of uninformative data: there isn't enough data to reject macro models. But that is because models are too complex to be rejected given the paucity of data. Using data to increase the complexity of models (without rejecting simpler models) goes against George E. P. Box's advice "all models are wrong":
Since all models are wrong the scientist cannot obtain a "correct" one by excessive elaboration. On the contrary following William of Occam he should seek an economical description of natural phenomena. Just as the ability to devise simple but evocative models is the signature of the great scientist so overelaboration and overparameterization is often the mark of mediocrity. (1976)
Emphasis mine. I discuss this more in this earlier post.

...

Footnotes

[1] There are some fairly accurate "theory free" (though not really) econometric models over given periods of time.

Saturday, January 23, 2016

The slope of the Phillips curve is roughly zero

There was (H/T Brad DeLong) a working paper out of the IMF in November of 2015 from Olivier Blanchard, Eugenio Cerutti, and Lawrence Summers titled [pdf] Inflation and Activity – Two Explorations and their Monetary Policy Implications. In it they plot the slope of the Phillips curve (second graph), falling from the 1960s to the present:


They say "[the Phillips curve slope] today is not only small, but statistically insignificant". Here is the result for the US (and Germany) in Figure 9 referenced in the graphic above:


This is consistent with my own finding (also from November of 2015):


The relative normalization of the slope is not relevant (the Phillips curve relates annualized percentages of inflation and unemployment, where as this is presented as a fractions -- you multiply by 12 to get annualized inflation and the Blanchard et al result).

Another observation is that the era of the Phillips curve corresponds to the era of the labor force growing faster than the population -- of increasing participation rate. If inflation is just related to labor force growth, then the Phillips curve would have primarily been about the temporary alignment  of employment growth and increasing participation rate.

Friday, January 22, 2016

Is CPI an information-theoretic measure of labor force size?

Update 25 Jan 2016: This model gets much better: 
http://informationtransfereconomics.blogspot.com/2016/01/its-people-economy-is-made-out-of-people.html 
Update 23 Jan 2016: Since this post is getting a lot more traffic than I expected, I'm adding a direct link to what is meant by information equilibrium and to my paper: 
http://informationtransfereconomics.blogspot.com/2015/12/information-theory-101-information.html 
http://econpapers.repec.org/RePEc:arx:papers:1510.02435
I noticed something today while randomly plotting various macroeconomic indicators, and so built an information equilibrium model to quantify it. The civilian labor force (CLF) looks a bit like core CPI, so I put together the information equilibrium model

CPI ⇄ CLF

So that

log CPI = a log CLF + b

and

(d/dt) log CPI = a (d/dt) log CLF

which means that the inflation rate is a times the labor force growth rate. This gives us a decent model (after adding a lag and smoothing the CLF -- a surprisingly noisy measure):


Here's a version you can play with yourself at FRED where I fit a = 2.67. This model means CPI and CLF are in information equilibrium -- that fluctuations in CLF result in informationally equivalent fluctuations in CPI (plus noise).

This tells a different story of inflation in the US than exists in the mainstream, especially if you compare the CLF growth rate with the population growth rate:


During the 1960s and 70s, we had a labor force growing faster than population -- typically associated with people other than white males entering the labor force (women, African Americans). This coincided with the period of high inflation in the US. As always, there is a question of causality -- the fit at the top of the post chose a lag of y₀ = 0.33 years with CLF increases causing inflation about 4 months later.

The usual story of the end of the so-called great inflation of the 1970s was that the Volcker Fed managed to credibly rein in monetary policy, reducing inflation.

The new story is that either 1) the Fed was superfluous, or 2) the Fed's impact came through a different channel. In 1), the labor force had reached its new equilibrium participation rate, so it stopped growing as fast, lowering inflation. In 2), the Fed-caused recessions of the 1980s killed the rise in labor force participation (setting up the new equilibrium).

Similarly, the recent lack of inflation may have nothing to do with the Fed. We can see in the figure above the changes in the CLF roughly match the population growth rate. The recent lack of inflation is simply due to slow population growth in the US. It is quite a coincidence that as our population growth rate fell below 0.75% per year, it became hard for the Fed to maintain 2% inflation (given a = 2.67).

The lowflation in Europe, the US and Japan may simply be low population growth -- and independent of the ECB, Fed. and BoJ. This would also mean inflation targeting by the central bank is a case of Feynman's cargo cult science -- they literally had zero control except to cause recessions by creating a coordinating signal for sunspots [1].

Increasing labor force participation just leads to a spike in inflation that can last several years (as the US saw in the 60s and 70s). To generate sustainable inflation, governments would need to increase the population growth rate.

...

Update #1

With the relationship between the growth rates being a ~ 3, we can take population growth to be the growth in radius r and inflation to be the growth in volume V ~ r³ of a sphere. While the volume numbers differ from the radius numbers, any signal in the change of the radius can be read off the change in volume.

Update #2

Also works for Japan


Update #3

And Canada


Update #4

Switched from LOESS smoothing to moving average for the US and Canada model since I used a moving average in the model for Japan.

Update #5

These posts on the "miracle" of a 2% inflation target ("magic number") alongside 2% inflation are relevant as well:


...

Footnotes:
[1] In Farmer's paper Global Sunspots and Asset Prices in a Monetary Economy, the Fed is Mr. W (the coordinating source of "sunspots"):
What coordinates beliefs on a sunspot equilibrium? Suppose that Mr. A and Mr. B believe the writing of an influential financial journalist, Mr. W. Mr. W writes a weekly column for the fictitious Lombard Street Journal and his writing is known to be an uncannily accurate prediction of asset prices. Mr. W only ever writes two types of article; one of them, his optimistic piece, has historically been associated with a 10% increase in the price of trees. His second, pessimistic piece, is always associated with a 10% fall in the price of trees. 
Mr. A and Mr. B are both aware that Mr. W makes accurate predictions and, wishing to insure against wealth fluctuations, they use the articles of Mr. W to write a contract. In the event that Mr. W writes an optimistic piece, Mr. A agrees, in advance, that he will transfer wealth to Mr. B. In the event that Mr. W writes a pessimistic piece, the transfer is in the other direction. These contracts have the effect of ensuring that Mr. W’s predictions are self-fulfilling.

I'm changing with my mind

Wikimedia commons.
Since everyone else seems to be doing it, I thought I'd list some things where I changed my mind based on empirical data (as some sort of prior flexibility display). Unfortunately as a physicist, I don't have a lot of economics-relevant items. Actually there is just one:

  • I went from believing inflation expectations at the zero bound could raise inflation to seeing that most empirical measures of expectations were backward-looking -- and therefore couldn't be a guide for much of anything in the future. In that sense I drifted from thinking Krugman was right (expectations were possible, but hard for central banks at the zero bound) to Sumner was right (expectations were easy for central banks) to both theories being either untestable and/or inconsistent with empirical data. In a sense, wrestling with this lead directly to this blog.

On most other topics in econ, I haven't formed a strong enough opinion to warrant some kind of adjustment of my priors. I kind of view the subject like I do various statistical health studies -- Drink coffee! Don't drink coffee! I'm not sure where we are on that.

As for physics/science:

  • Non-zero cosmological constant. This came out while I was an undergrad and I didn't believe it at first. Since it such a serious fine-tuning problem, I thought it would be zero. More data eventually convinced me that it was a real thing.
  • LIGO could successfully measure gravity waves. I used to think this would be impossible, but the papers on the calibration have made me reconsider it. I'm now just ambivalent. It has come up recently in the news and my attitude is wait and see rather than dismissal.
  • Placebo effect (warning: picture of surgery at link). It's not that I didn't think it was real -- it's more that I've become more tolerant of "alternative medicines" operating through it ... in fact, a significant fraction of mainstream treatments might operate through it as well.
PS The title is a Mystery Science Theater 3000 reference.