Well, this would probably count as a new shock to the bitcoin exchange rate:

In fact, you can model it as a new shock:

Since we're in the leading edge of it, it's pretty uncertain. However, I'd like to talk about something I've mentioned before: usefulness. While there is no particular reason to reject the bitcoin dynamic equilibrium model forecast, it does not appear to be useful. If shocks are this frequent, then the forecasting horizon is cut short by those shocks — and as such we might not ever get enough data without having to posit another shock thereby constantly increasing the number of parameters (and making e.g. the AIC worse).
Another way to put this is that unless the dynamic equilibrium model of exchange rates is confirmed by some other data, we won't be able to use the model to say anything about bitcoin exchange rates. Basically, the P(model|bitcoin data) will remain low, but it is possible that P(model|other data) could eventually lead us to a concurrence model.
As such, I'm going to slow down my update rate following this model [I still want to track it to see how the data evolves]. Consider this a failure of model usefulness.
...
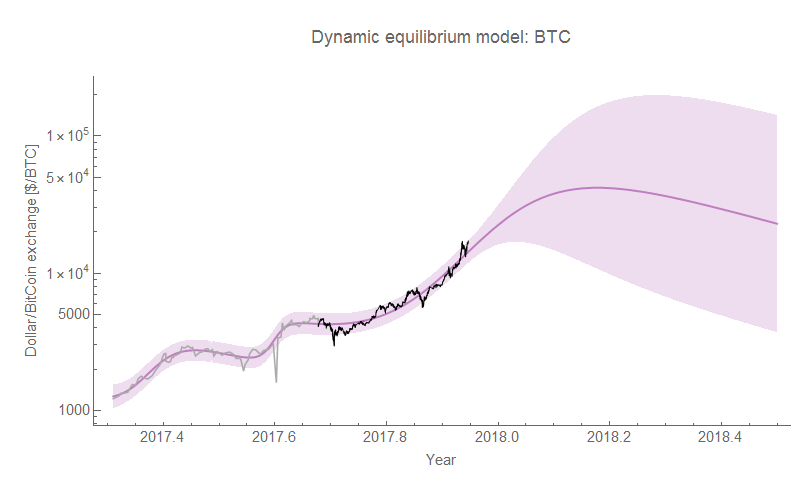
Update 17 October 2017
Starting to get a handle on the magnitude of the shock — it's on the order of the same size as the bitcoin fork shock (note: log scale):

Update 18 October 2017
More data just reduced uncertainty without affecting the path — which is actually a really good indication of a really good model! Too bad these shocks come too frequently.

Update 23 October 2017

Update 25 October 2017

Update 30 October 2017

Update 1 November 2017

Update 2 November 2017

Update 6 November 2017

Update 9 November 2017

Update 10 November 2017

Update 13 November 2017

Update 14 November 2017

Update 16 November 2017

Update 28 November 2017

Update 30 November 2017

Update 7 December 2017
Despite this having been wrong, it's been fun following it. One thing I have come to recognize is that even in the unemployment forecasts there is a tendency to undershoot and then overshoot the magnitude of shocks. A few more graphs:


Update 15 December 2017
I re-graphed the solutions with the expanded scope since December 11th on the same y-axis and added the latest data:


Update 19 December 2017

Update 20 December 2017

Update 25 December 2017

Update 02 January 2018

Update 08 January 2018

Update 15 January 2018

Update 5 February 2018 (with Jan 22 and Jan 31)


26 February 2018

17 April 2018


...
Update 17 October 2017
Starting to get a handle on the magnitude of the shock — it's on the order of the same size as the bitcoin fork shock (note: log scale):

Update 18 October 2017
More data just reduced uncertainty without affecting the path — which is actually a really good indication of a really good model! Too bad these shocks come too frequently.

Update 23 October 2017

Update 25 October 2017

Update 30 October 2017

Update 1 November 2017

Update 2 November 2017

Update 6 November 2017

Update 9 November 2017

Update 10 November 2017

Update 13 November 2017

Update 14 November 2017

Update 16 November 2017

Update 28 November 2017

Update 30 November 2017

Update 7 December 2017
Despite this having been wrong, it's been fun following it. One thing I have come to recognize is that even in the unemployment forecasts there is a tendency to undershoot and then overshoot the magnitude of shocks. A few more graphs:


Update 15 December 2017
I re-graphed the solutions with the expanded scope since December 11th on the same y-axis and added the latest data:


Update 19 December 2017

Update 20 December 2017

Update 25 December 2017

Update 02 January 2018

Update 08 January 2018

Update 15 January 2018

Update 5 February 2018 (with Jan 22 and Jan 31)


26 February 2018

17 April 2018


No comments:
Post a Comment
Comments are welcome. Please see the Moderation and comment policy.
Also, try to avoid the use of dollar signs as they interfere with my setup of mathjax. I left it set up that way because I think this is funny for an economics blog. You can use € or £ instead.
Note: Only a member of this blog may post a comment.