I haven't compared my S&P 500 forecast to data in a few months (last time in early June). The original forecast was made back in January 2017, and the two years will be complete come January 2019. The post-forecast data is shown in black:
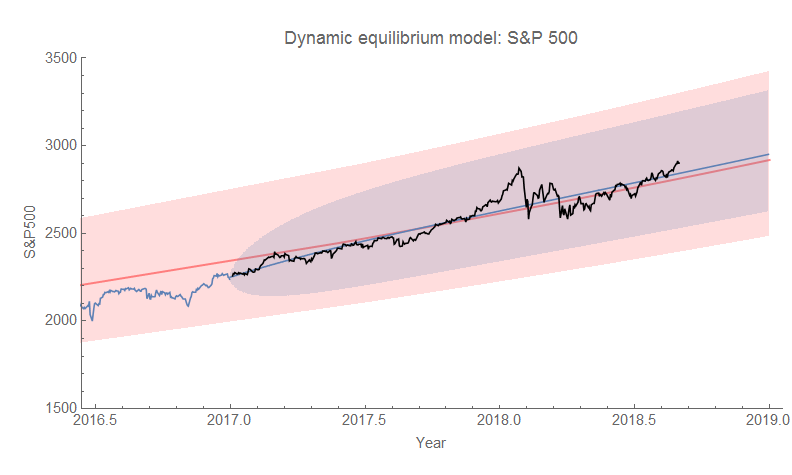
The pink band represents the model error, while the blue band (overlaid with pink making it purple) represents an AR process — specifically an ARMA(2,1) process — forecast from the last data point (i.e. taking into account the random component, as discussed in a footnote here). The increase in volatility since the corporate tax cut is definitely visible in the data. There was a poster about volatility regimes presented by Tobias Sichert at ASSA 2018 which is relevant (discussed here), and possibly foreshadowing a future recession ...

My impression is that the opening salvos of the trade wars led to the increased volatility. I publicly suggested putting a straddle on S&P 500 ETFs back in February which has ptovep very profitable.
ReplyDeleteIt's possible, but it seems to come right when the stock market dropped which I thought was profit-taking from the run-up to the corporate tax cut. But then, I've never been very good at these things :)
DeleteIf you look at stock market data in Canada, China, and Mexico, for example, you'll see similar patterns, all beginning in the same date in late January.
ReplyDeleteThe EU is a bit less clear perhaps, due to problems in Italy, for example, but you can see the pattern there too.
It would be interesting to see the IE model for the Nikkei 225 index around 1985-1991, the period of the Japanese asset price boom and bust. The performance of the index in those years, and since then, has been very different from other stock indices - the curve isn't exponential as it is with the S&P 500.
ReplyDeleteSorry I missed this comment — blogger is not notifying me of comments anymore for some reason.
DeleteI did look at the Nikkei back in February 2017 ...
https://informationtransfereconomics.blogspot.com/2017/02/nikkei-225.html