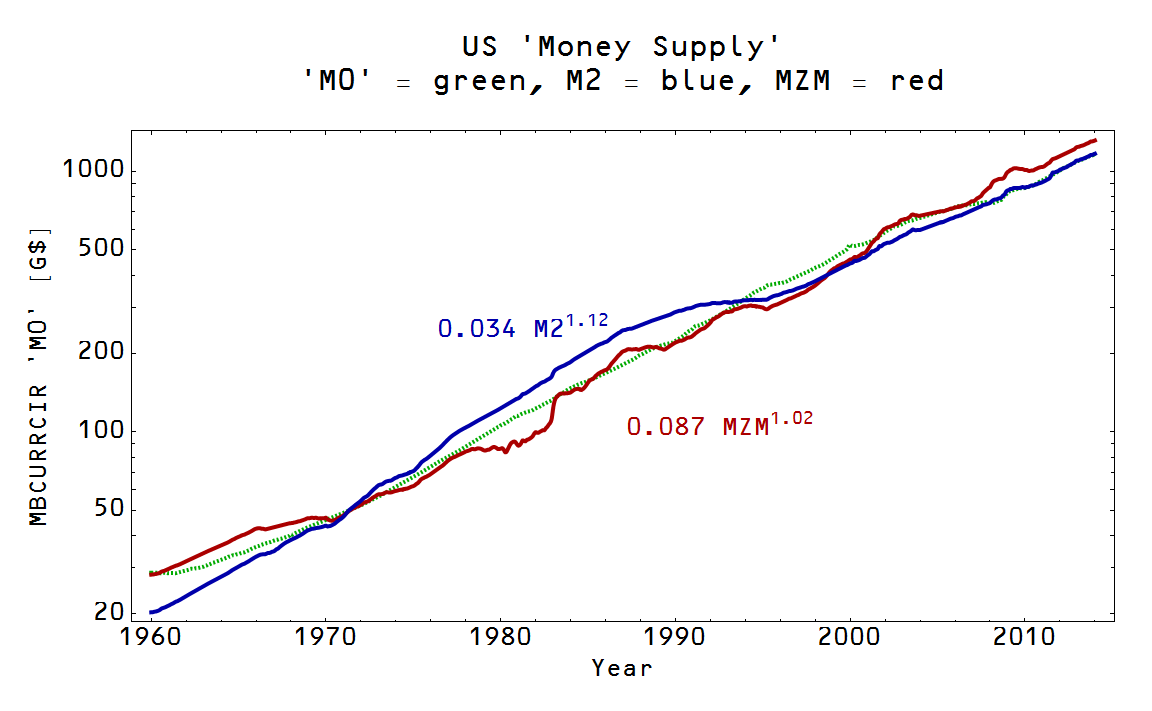
I don't know. How's that for a beginning? If we take the currency in circulation (MBCURRCIR at FRED aka 'M0') to be the supply and either M = M2 or MZM to be the demand, we have the solution to the differential equation M = a M0^(1/κ) (first plot, money demand in terms of supply) or it's inverse M0 = b M^κ (second plot, money supply in terms of demand) ... these result in decent, but not amazing fits:

One pedagogical point: in this case the units on each side are the same information-wise (dollars), hence κ doesn't vary when demand is dollars like it does when demand is "dollars of goods and services" (NGDP). Also note that κ ~ 1 in both cases implying that the "price" of money P ~ M0^(1/κ-1) is roughly constant. Another way, the "exchange rate" between demanded money and supplied money is constant.
Jason, what does the G stand for in [G$]? Thousands?
ReplyDeleteSo in the left plot, the dotted blue line is 20.5*M0^0.89 while the solid blue is M2? And likewise the dotted red line is 10.9*M0^0.98 while the solid red line is MZM?
One thing that Mishkin, Chapter 25 points out (the chapter on the more elaborate money multiplier) is that this multiplier (m), defined as
Deletem = (1+c)/(r+e+c)
where
c = currency held by public / checkable deposits
r = required reserves / checkable deposits
e = excess resereves / checkable deposits
is determined by four entities:
1. central bank
2. banks
3. depositors
4. borrowers
The equation itself is just an identity if you substitute in the definitions and simplify: it's clear that:
m = M/MB
So Mishkin makes a clear distinction between borrowers and depositors. That *I think* lies at the heart of posts like the one Nick Rowe put together on "The sense in which the stock of money is "supply-determined""
He's draws a simple example in there in which the CB does all the banking, and there's no deposits (checkable or CB), everything is done in cash, and all borrowers are assumed credit worthy, and the CB sets a fixed rate of interest. Thus the CB and the borrowers together determine the money stock, but the "demand for money" is different than the demand for money from the borrowers alone, and it reacts to the stock of money determined by the CB & borrowers, eventually becoming equal to that stock. His point was that the general demand for money does NOT determine the stock of money.
Why am I telling you all this? Good question... I guess I'm wondering if there's room for a difference between the demand for money amongst borrowers and the general demand for money in your model here. BTW, here's my write up on that example:
http://banking-discussion.blogspot.com/2014/03/nick-rowes-example-from-sense-in-which.html
BTW, I followed your link down to where you explain the solution to the differential equation and get into Feynman diagrams... you lose me there... not a surprise I guess! :D ... I think I get the overall message though. You found a good fit for price level vs time (your final conclusion).
Regarding your first questions, G = Giga = billions, and yes about the dotted red/blue (M0) vs solid red/blue (MZM and M2).
DeleteI'll mull the Mishkin stuff a bit.
Jason, O/T:, I may have asked you this already... if I did I apologize, but here goes anyway: Can ITM offer any solution to Nick's question here:
ReplyDeletehttp://macromarketmusings.blogspot.com/2014/04/the-cure-for-neo-fisherism-history.html?showComment=1398723933833#c3856755014857782342
Essentially he's still in the "don't know" camp on that. Can you help him out? :D
Inflation didn't fall farther because inflation is only indirectly connected to the zero lower bound. Inflation is related to NGDP and MBCURRCIR (the white surface in the picture at the top right of the blog) while the "liquidity trap interest rate" depends on ∂P/∂MBCURRCIR ≈ 0 (the dashed line in the picture at the top right of the blog projected onto the interest rate surface in red).
DeleteI discussed this some at this post:
http://informationtransfereconomics.blogspot.com/2013/09/the-liquidity-trap-and-information-trap.html
Jason, thanks. I think it's really interesting that you have an answer for that. Now I have to stew on it a bit and see why that makes sense.
DeleteJason, also O/T: I left this question for you at pragcap, but not sure how frequently you visit there, so I'll repost:
ReplyDeleteDoes ITM have anything to say about Miles Kimball's proposal for "abolishing the ZLB?" Do you think that concept would also run up against the same problem that US and Japan have now?
... that is w/o a brief bout of hyperinflation to get us back on track?
DeleteI will reply at pragcap as well ...
DeleteAbolishing the ZLB could fundamentally change the relationship log r ~ \log NGDP/MB (right now, the interest rate can't be negative in the IT model -- it's a ratio of two positive quantities times a positive constant). I don't know what it would do, but it would certainly do something to the short term Treasury markets.
Fed Up left a question for you there.
DeleteJason, thanks for your responses.
ReplyDeleteO/T: I've noticed that David Beckworth and Mark Sadowski have both recently had a debate with Amir Sufi and his co-author about what really caused the 2008 recession: household debt deleveraging or the ZLB (and by implication then, bad monetary policy). Sumner tells Mark to cut them some slack:
http://macromarketmusings.blogspot.com/2014/05/what-caused-great-recession-household.html
http://www.themoneyillusion.com/?p=26739#comment-346574
http://www.themoneyillusion.com/?p=26739#comment-346583
Does the ITM inform your opinion on this one way or the other?
I don't have any specific insight into the "true cause". In this post, I put forward the theory that the Fed caused the crisis:
Deletehttp://informationtransfereconomics.blogspot.com/2014/02/the-fed-caused-great-recession.html
... but not in a conventional quantity theory of money way. There is an NGDP shock that can't be accounted for by looking at MBCURRCIR alone in the price level model. You can account for the effect if you look at the information transfer version of the IS-LM model. The Fed "effectively" raised interest rates for a couple of years before the crisis (the Fed lowered interest rates, but didn't lower interest rates enough). This puts downward pressure on AD. Eventually, per the sand pile analogy, AD falls.
However the NGDP shock could be completely exogenous and have come from e.g. the financial crisis. It could even be a massive fail of expectations per this mechanism.
The reason the recession was so bad does have a particular explanation in the ITM, though. Regardless of what caused the NGDP shock, it happened at a time when MBCURRCIR was large relative to NGDP, so monetary policy had little traction to offset the shock.
BTW, "stone" had a question for you here:
ReplyDeletehttp://monetaryreflections.blogspot.com/2014/05/neo-fisherites-and-fiscal-policy.html?showComment=1399877462621#c4928978058946615759