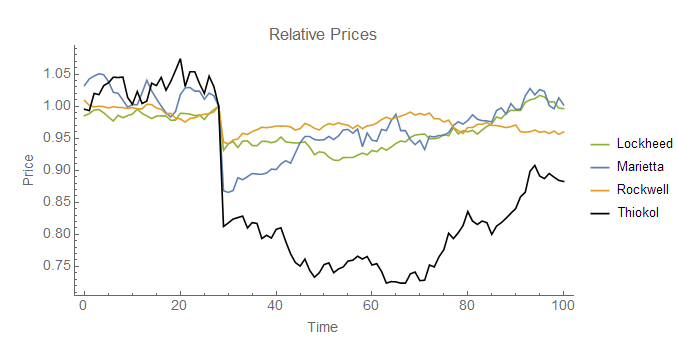
Ever the market boosters, Marginal Revolution has a new video out in its personal finance series that talks about the efficient markets hypothesis. Leave aside the fact that it might be questionable to base financial decisions on an hypothesis. I haven't watched the video, but from the still it appears to reference the Challenger disaster. It's an interesting story propagated by believers in the wisdom of crowds. On the surface, the market appears to have discovered the problem was with the solid rocket boosters since Morton Thiokol's stock dropped more than the other NASA contractors involved with the shuttle program. Here's a paper [pdf] that investigates it. Now of course this could be attributable to larger exposure to NASA (Thiokol had about twice as much revenue from its shuttle program per the pdf) as well as Thiokol being a smaller, less diversified company than Lockheed, Marietta, or Rockwell at the time (see John Quiggin here). Here is a graph of stock prices from here:

But what does the information equilibrium model have to say?
The key piece of information comes from the study referenced above. Average daily returns for the previous three months was given in Table 1: Lockheed (0.07%), Marietta (0.14%), Rockwell (0.06%) and Thiokol (0.21%). If we assume all of these companies are information equilibrium with the same underlying process X, these differential growth rates imply different information transfer (IT) indices. For example, the IT index k -- well, actually it's k - 1 since log p ~ (k-1) log X -- is about three times higher for Thiokol than for Lockheed. This means that even given the same source of information, Thiokol will respond quite a bit more than Lockheed to the same shock. And some simulations bear this out; here's a typical example based on the growth and volatility in the paper cited above:

Note that the underlying process X is the same (a Wiener process with constant drift and volatility) but are different realized values. Here's a Monte Carlo with 100 throws per company:

In the information equilibrium model, the prices seem perfectly consistent with all four contractors being hit with the same information shock -- and therefore there's no evidence the market figured out the cause within minutes of the disaster.
PS My grade school mascot was the Challenger shuttle (I grew up in the suburbs of Houston).
PPS I got to take a tour of the orbiter processing facility while NASA was preparing Discovery, Atlantis, and Endeavor were being prepared for the museums. Here's Discovery in the OPF with its aerodynamic engine cover before being flown to Washington, DC:


It's a great paper they reference, but I do feel (anyone know a free way to find market caps and company composition for '86?) you deliver the killing blow in your reference to fundamentals.
ReplyDeleteJust pricing in the possibility of a space shuttle pause would hit different companies expected free cash flow differently. Without accounting for such differences, the paper is a intellectual gem but not an account for 'how markets work'.
I tried to find market cap information, but it seems Wolfram data services only has access to company financial data for companies that currently exist.
DeleteI agree that would be key to understand. For example, even though Thiokol had 18% of revenues from the shuttle program (per the linked pdf in the post above) and Lockheed had about half as much at 9%, we can't assume that market agents assign the impact of the disaster proportionally. A plausible first approximation is that the level of impact is equal -- say 200 million per company -- which would impact the different size (market cap) companies differently.
My approach above used growth rate essentially as a proxy for company size.
Agreed that this is a excellent example of a practical application of ITE. So basically if I understand it, daily price changes are proportional to the information transfer constant for the stock (minus one). This is a post I have been hoping you would write for some time, with regard to the stock market. Very interesting, food for thought, I wonder if there are any investing/stock valuation insights to be gained from ITE. Will play around with this a little and think about it.
ReplyDeleteSort of ... I would break it down by industry (or even finer like above: space programs) and the IT index might change over time. There are some major assumptions involved.
DeleteAbove, we were looking at three months of daily returns and assuming a common X-factor (space programs) that market cap (M) was in information equilibrium with so that stock price (p) would be:
log M ~ k log X
log p ~ (k-1) log X
with k roughly constant over the previous three months. I did assume a growth rate (r) of X ~ exp r t of about 0.02% so that e.g. Lockheed had k-1 = 0.07/0.02 = 3.5 so that k = 4.5. Thiokol was k-1 = 0.21/0.02 = 10.5 so that k = 11.5.
There is no reason to expect e.g. Apple to to be in information equilibrium with the same X factor as e.g. Lockheed-Martin, so the daily returns wouldn't tell you anything about their relative IT indices.
The link just below the first chart is that stock price model.