Update 25 October 2016: check out this follow up using principal component analysis.
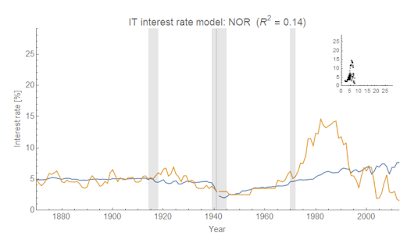
I was directed to this long time series macro data [1] by a reader via email, and so thought I'd try the IT interest rate model:
I was directed to this long time series macro data [1] by a reader via email, and so thought I'd try the IT interest rate model:
log(r) = a log(NGDP/MB) + b
Only a few series fit over the entire time period with one set of parameters {a, b}, but this should be expected because e.g. several European countries are now on the Euro. So I attempted to look for a natural way to break up the data using cluster analysis to find linear segments -- finding clusters associated by a given range of years, log(r) and log(NGDP/M0). Here are the clusters for the USA and DEU:
Note these are 2D representations of a 3D graph (imagine time going into the page).
I'm still looking at the fit methodology. Some of the data doesn't need to be broken up (particularly the Anglophone countries: USA, CAN, AUS, and GBR -- though I broke up USA and AUS in the graphs below). Many of the European countries do -- and the best place to break tends to be around World War II. Some preliminary results are listed below:
NOR and DEU (Norway and Germany) don't work very well unless you break up the data into many segments (about 4-5).
Nearly all of the countries that don't work well are currently on the Euro, or had pegged their currencies to some other currency at some point.
Anyway, this is a work in progress. I am going to try and map the break points to details of monetary history of the various countries.
...
Footnotes:
[1] Òscar Jordà, Moritz Schularick, and Alan M. Taylor. 2017. “Macrofinancial History and the New Business Cycle Facts.” in NBER Macroeconomics Annual 2016, volume 31, edited by Martin Eichenbaum and Jonathan A. Parker. Chicago: University of Chicago Press.


North Sea oil started to flow in the 1970s. This transformed the Norwegian economy and allowed it to build up its wealth fund. I don't think that the wealth fund started to grow until the early 1980s though as E&P investment would have been very high in the 1970s.
ReplyDeleteI am surprised that there isn't a break in the German model around 1990 when re-unification took place. The West German economy (63 million people) effectively absorbed the backward East German population (16 million people) as a one-off event.
Actually Germany needed 5 breaks to factor into clusters with the clustering algorithm, including one near 1990 but I thought that was too many (if you chop up data into too many segments, it will get a high R^2 just because the short data segments are approximately linear -- overfitting).
DeleteI ended up limiting to two breaks arbitrarily to limit overfitting -- but I am going to write an algorithm that finds the optimal number of breaks.
Thanks for the information Norway. My hope is that once the algorithm is finalized, it will determine several years that match up with major events (wars, currencies being pegged, revalued, etc).