I know how to get it
Although I tried it already, I thought I'd do this for the UK. I re-used some the data I used in this attempt, however the problem with that was that there was insufficient data from the period before the recent crisis so the fit over-weighted it. The reserves component of the base only goes back to 2006, and the currency component only goes back to 1996, so in reality I was only working with data from 2006-2013.
Therefore I decided to use some extrapolation (linear extrapolation in log space) as well as (for the first time) actually trusting my interest rate model in order to determine the monetary base further back. It worked when I used a fit to US interest rates from 1960-2013 on data from 1930-1960, so I figured I could extrapolate the monetary base data back to 1986 through the interest rate data from FRED.
I did it in two stages. First, I did a linear extrapolation (in log space) of the reserve balances data before 2008 back to the beginning of the currency data (1996). This formed the basis for a fit to the interest rate:

The dashed blue curve represents using the interest rate model to extrapolate the 1996-extrapolated data (solid blue curve) to 1986. The 3-month LIBOR data is green. The resulting monetary base is shown here:

Green is actual reserve balance data, red is actual currency data, dark blue is the 1996-extrapolated data (the sum of the currency and extrapolated reserves) and light blue is the interest rate 1986-extrapolated data. Using this monetary base, we can now show the model (blue) of the price level (CPI data less food and energy, green):
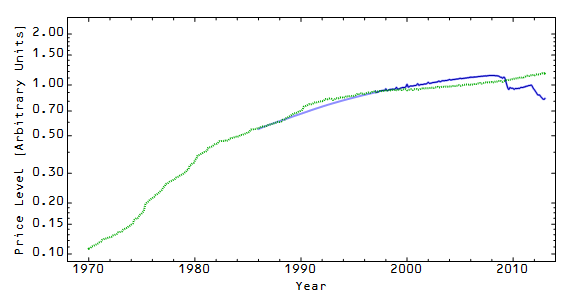
This is an improvement over the original result, but still shows a deviation for the current crisis that is not as apparent in the US model. We'll see how this progresses over time. Maybe this is real and deflation will set in in the UK. Inflation is in fact falling. However this more likely represents residual model error.
What is interesting is that if we plot the path in NGDP-MB space, the information trap rate in the UK seems to be about 3% (it is 2% in the EU, 1% in Japan and 0.1% in the US):

The red lines represent constant interest rates, the dashed black line is the information trap criterion (∂P/∂MB = 0) and the actual path (well, extrapolated path) is shown in blue.
Update 21 January 2017
Another more recent post with a better model is here.
Update 21 January 2017
Another more recent post with a better model is here.
No comments:
Post a Comment
Comments are welcome. Please see the Moderation and comment policy.
Also, try to avoid the use of dollar signs as they interfere with my setup of mathjax. I left it set up that way because I think this is funny for an economics blog. You can use € or £ instead.
Note: Only a member of this blog may post a comment.