Today, we got another data point that lines up with the dynamic information equilibrium model (DIEM) forecast from 2017 (as well as labor force participation):
As a side note, I applied the recession detection algorithm to Australian data after a tweet from Cameron Murray:
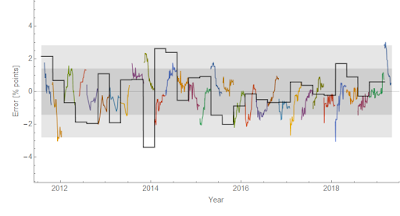
The employment situation data flows into GDPnow calculations, and I looked at the performance of those forecasts compared to a constant 2.4% RGDP growth:
It turns out there is some information in the later forecasts from GDPnow with the final update (a day before the BEA releases its initial estimate) having about half the error spread (in terms of standard deviations). However, incorporating the 2014 mini-boom and the TCJA effect brings the constant model much closer to the GDPnow performance (from 300 down to 200 bp at 95% CL versus 150 bp at 95% CL — with no effect of eliminating the the mini-boom or TCJA bumps).


Thanks for the nice updates.
ReplyDeleteOn a related topic, I wonder if you have any thoughts on estimating near-term recession probabilities. I tried to do some crude work after seeing the flurry of stories that followed the most recent yield curve inversion. Sure enough, I was able to corroborate in some sense the models and indicators that purport to find an updated probability as high as 30-40%. Yet when I applied simplistic heuristics to some other macro data and indicators, I found some that suggested probabilities as low as ~5% and others at roughly every level in between (~10%, ~20%, etc.). Furthermore, I have wondered about base rates and whether there is a sensible way to refine those based on conditional probabilities. Anyway, I'm sorry if I asked you something similar in the past, but since you alluded to your "recession detection algorithm" again, I wonder if you had any thoughts on the ability to estimate and update recession probabilities.
Many thanks!
PS: Also, I wonder if it would be more helpful to rephrase the question this way, which is whether you think it would be possible to invert the logic of your "recession detection algorithm" to spit out, instead of a binary yes or no relative to some set confidence interval, rather the probability of upcoming recession conditioned on where the unemployment rate or its trajectory is in relation to the prevailing model?
DeleteOr, if that is not straightforward enough, perhaps you could answer the following question:
Assuming you are using something like 95% CI's in your algorithm, does that support the naive inference that when your algorithm has been calibrated to detect past recessions in sample, it is like saying that your analysis of the data suggested that the probability of recession had reached 95% (e.g., in September 1990, April 2001, and December 2007, where I'm pulling these from your former post: https://informationtransfereconomics.blogspot.com/2017/04/determining-recessions-with-algorithm.html)? Because, correct me if I'm wrong, but that would be seem to be some serious confidence and extremely valuable if it continued to work out of sample.
Anyway, thanks, again!
I have give some thought to assessing the probability of recession, and yes you could come up with a metric based on the detection algorithm — e.g. each new data point has some probability that it is measuring a much higher actual unemployment rate and the probability that the higher rate is over the detection threshold gives a probability of recession.
DeleteHowever, as the detection threshold is essentially at the 99.99999% CL (6-sigma), any data point that falls in the 90% CL (the gray band in the graphs above) means something close to 0% probability of recession until data points leave the gray band.
There are two additional thoughts here:
1. There seems to be some information in the confidence bands, but it is unclear how to robustly extract it. I did an example comparison with the Greenbook forecasts from the Fed through the Great Recession to show how it might look in real time.
https://informationtransfereconomics.blogspot.com/2018/09/forecasting-great-recession.html
2. It seems JOLTS data is actually a better leading indicator (hires shocks leads unemployment rate shocks by about 5 months over the past 4 shocks).
https://informationtransfereconomics.blogspot.com/2018/10/building-models.html
Thanks, Jason. It sounds like my intuition is closer to the interpretation you gave of your model (i.e., very low probability as long as the data is within a couple sigma of the model), than it is to some of these indicators that are already spitting out large probabilities. But thank you for trying to help with my questions because I'm still not sure how to take my intuition and turn it into anything more robust than that.
DeleteI suppose someone might argue (1) that at least we should have the empirical frequency with which the data in the past has jumped up from following close to your model to tripping the detection threshold (yet I imagine this would only give us something close to the crude base rates) or (2) that perhaps there is a way to extract information about the probability that the data will be jumping up to the detection threshold within the next set of periods. Regarding the latter, I'm generally skeptical of even the existence of such information let alone the ability to extract it. In fact, this is why your DIEMs seem so appealing – they seem limited to a reasonable level of ambition.
Will check out the links. Thanks, again!
Definitely. One of the issues here is that (if the DIEM is correct) the initial signs of a recession appear in the exponential tails of a logistic function — and therefore would be invisible almost until you are on top of it.
DeleteIn a similar vein, there was a bunch of research about how you might detect some kind of social uprising based on graph/network theory. But there are coloring theorems about how e.g. if N random links connect nodes the probability you get a large connected component goes as ~exp(N). Basically, there are no signs until it suddenly happens.
Recessions might well be the same.