Now I don't really look at the information equilibrium models for markets as particularly informative (looking at the error band spreads should tell you all you need to know about that) — this should be taken with a grain of salt. And always remember: I'm a crackpot physicist, not a financial adviser.
With that out the way, here's what the recent drop in the markets looks like on the S&P 500 model:

Curiously, we seem to be back in the post-Tariff equilibrium after the past few months of out-performing that expectation. We are at the edge of the 90% band estimated on post-recession data (blue), and entering into the 90% band estimated on the entire range of data since 1950 (lighter green).
I should also note that in the past, the recession process is never really a single drop straight down. It's a series of drops over the course of months with some moments of recovery:

That does not mean the recent drop is not the start of such a series, just that it's entirely possible this could turn around.
Is this a prelude to a recession? Maybe, maybe not. For one thing, it will be different from the past two "asset bubble era" recessions (dot-com in 2001 and housing in 2008) given there's no discernible asset bubble in recent GDP data:
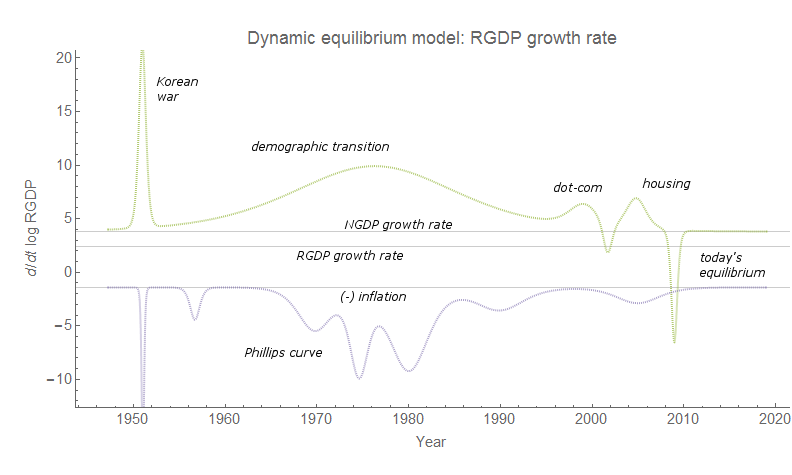
It would be an example of a non-Minky recession! (At least if this isn't some kind of shadow economy crisis — the housing boom didn't show up in the stock market, but does show up in GDP, while the dot-com boom shows up in both.)
We are basically reaching my "limits to growth" hypothesis — that recessions happen when wage growth exceeds GDP growth, thus eating into profits. (In fact, that interacts with the asset bubbles as the asset bubbles boost GDP allowing wage growth to go higher than it would have without the bubble.) This graph shows the DIEM trend of GDP (blue line), the wage growth DIEM (green line) as well as projected paths (dashed) and a recession counterfactual (dotted green).

But there's another aspect that I've been carrying along since this blog started — that spontaneous drops in "entropy" (i.e. agents bunching up in the state space by all doing the same thing, like panicking) — are behind recessions. These spontaneous falls make economics entirely different from thermodynamics where they're disallowed by the second law, by the way (atoms don't get scared and cower in the corner). This human social behavior would ostensibly be triggered by news events that serve to coordinate behavior — unexpected Fed announcements, bad employment reports, yield curve inversion, or in this case a possible global pandemic. Or all of the above? I imagine if the Fed comes out of its next meeting in March with no interest rate cut, it might make a recession inevitable.
The 10-year rate is back at the bottom of the range of expected values from this 2015 (!) forecast:

And the interest rate spreads are trending back down and inverting again:

One thing to note is that while the median daily spread data (red) dipped into the range of turnaround points seen before a recession in the past three recessions several months ago, the monthly (average) spread data (orange) did not go that low (n.b. the monthly average is what I used to derive the metrics). We also didn't see interest rates rise into the range seen before a recession (which tends to be caused by the Fed lowering interest rates in the face of bad economic news). An inversion or near miss followed by another inversion is not exactly unknown in the time series data, either.
JOLTS openings and the market
The latest JOLTS job openings data released earlier this month (data for December 2019) showed a dramatic drop even compared to the 2019 re-estimate of the dynamic equilibrium rate:

This appears to be right on schedule with the market correlation I noticed a few months ago:

The recent drop (December 2019) matches up with the drop at the beginning of that same year (Jan 2019) in the aftermath of the December 2018 rate hike. If this correlation holds up, the job openings rate will rise back up and then fall again in January 2021 (about 11 months after Feb 2020). But the other possibility is that this is the first sign of a recession — the JOLTS measures all appear to lead the unemployment rate (via e.g. Sahm Rule) as an indicator. However, JOLTS is noiser (which requires a higher threshold parameter) and later than the unemployment rate. JOLTS comes out 2 months after the data it's representing (the data for December 2019 came out mid-February 2020, while the unemployment rate for December 2019 came out the first week of January 2020), so whether it's a better indicator than the unemployment rate remains to be seen — there's a complex interplay of noise, data availability, and revisions (!) that makes me think we should just stick to Sahm's rule.
I'll be looking forward to the (likely revised!) JOLTS data coming with the Fed's March meeting.
...
Update 8 March 2019
I updated the graphs with a few more days of data, including a Fed rate cut (visible in the spread data). Click to enlarge:


your idea of drop in entropy would be similar to fallacy of composition? where once enough people start doing it there is a change in the base state and forces new change into the system. ie once enough people stand up you cant really sit down again, that equilibrium is past but maybe you can move to the aisles or push in front of people. either way the old equilibrium is now fractured so anything reliant on that would need to readjust. which is similar to kalecki view i think
ReplyDeleteI think you can think of it that way, but the entropy drop is more general. If everyone tries to do the same thing, people are no longer fully exploring the state space = entropy drop. But also, if any single state becomes more or less likely, that is an entropy change. For example, the "hot potato" effect is also an entropy drop with a subsequent return to equilibrium:
Deletehttps://informationtransfereconomics.blogspot.com/2015/07/updated-graphics-for-entropic-hot.html
So is a change in how much people work:
https://informationtransfereconomics.blogspot.com/2015/08/entropy-is-working-for-weekend.html
I should probably say non-equilibrium process rather than entropy drop (in general non-equilibrium in thermodynamics means entropy isn't well defined ... and since it always increases in an isolated system, spontaneous drops aren't "well defined" in a physics sense — but are super important in economics).