Tuesday, April 17, 2018

Yes, I've read Duncan Foley. Have you?

I am not as familiar with the works of Pablo Neruda.
One of the most common comments I get asks (in varying degrees of stridency) whether I am aware of the work of Duncan Foley. Have you read Foley? or This has already been done by Foley. It seems people equate any reference to entropy and thermodynamics in economics with Foley.

The most time I've spent on this was answering an email from someone who read my book. In that context, it was completely understandable since I did not reference Foley in the book (for reasons described below). My recent paper directly cites Foley and even includes a footnote about the differences, and in that context I tend to be less charitable.

I am reproducing my email below (with some minor edits). However let me give a TL;DR
  • Foley and I may both use partition functions, but these are very general things in mathematics and the Lagrange multipliers and constraints are different — which are the only real properties of a partition function, meaning it's completely different. (I also construct the partition function from an ensemble of markets in my recent paper.)
  • Foley asserts prices are Lagrange multipliers (analogous to inverse temperature); in my work prices are measures of information flow and the Lagrange multipliers are related to the size of the economic state space. For Foley, prices determine whether an economy is "hot" or "cold"; for me, a "cold" economy would be large low-growth economy, and a "hot" economy would be a small, emerging one.
  • Foley's approach is so analogous to thermodynamics that you'd even have a second law. One of the most important properties of the information transfer approach is that it explicitly allows second law violations from the beginning (and they seem to be key to understanding disequilibrium scenarios like recessions).
  • Foley uses utility. I think utility is at worst garbage, at best an unobservable effective field.
  • Foley doesn't ever use his theory to describe empirical data, while I do. There are papers where Foley is a co-author that have empirical data in them, but any theoretical description of or lines through the data do not depend on the Foley's thermodynamic theory of economics (and are often just regressions). n.b. Happy to be corrected if I'm wrong about this.
  • It is my opinion (!) that Foley's approach isn't the best, but I don't think Foley is prima facie misguided or his approach will never lead to a successful theory. It could! It doesn't seem to have yielded any major empirical successes yet, however.
Anyway, here's (most of) my response to that email from a reader regarding Foley:

...

I am aware of Foley's work. One of the first things I did when I started applying communication/information theory to prediction markets and thought I had something new was a big literature search — and any search on entropy and economics brings up Foley. The strongest connection between my work and Foley's work is "statistical equilibrium" (whose terminology I've adopted) that I've talked about on my ... blog where I've also made several other references to Foley and Smith.

However there are also strong differences — in particular the constraint in the partition function and its "temperature" variable [Lagrange multiplier]. For example, in Foley (1996), prices are [analogous] to inverse temperature and the partition function defines an economic state with a well-defined maximum entropy "offer" (i.e. constraint).

The partition function I've looked at uses factors of production as the inverse temperature, and looks at an economy as a maximum entropy state with a well-defined growth rate. This "growth rate" is actually understood in terms of underlying information theory (matching demand "events" with supply "events" which we can think of as messages in communication theory).

There is a similarity in the discussion of entropy (I've made several references to Foley's statement that physics and econ are different because the formalism was set up to study irreversible processes in the latter — no one voluntarily undoes their utility gains — as opposed to reversible processes in the former). However, the information theory treatment tells us not to expect the second law of thermodynamics to hold because the conditions that make it hold are not met. A good example is that traders can all panic and try to sell causing a correlation that would violate the 2nd law; in contrast, atoms don't panic. This makes economics very different from thermodynamics. But I think a consequence of this is that Foley's thermodynamics can reproduce Walrasian/classical economics pretty well because there shouldn't be big market failures in classical economics.

That's just a couple of examples. There are others (e.g. I avoid most discussions of utility, but also show it is probably only a useful concept near equilibrium).

However since I didn't get that deep into statistical equilibrium in the book, and decided to base the book on economist Gary Becker's model (based on the suggestion from economist David Glasner that Becker's approach would be more persuasive/intuitive than my physics jargon), references to Foley fell by the wayside (as a side note, I also edited out a reference to Philip Mirowski because I thought it detracted from the narrative). In general, these references were too technical (I only touch on the 2nd law violation because you can illustrate it with Gary Becker's model) for what was supposed to be a book for a general audience. (I also think the physics jargon and direct analogies with thermodynamics are at least one barrier to traction for Foley and others [in mainstream economics].)

But you are right that I'm mostly focused on understanding empirical problems, partially because that's what I've always done as a physicist (I was technically a nuclear and particle theorist, but most of what I did was build models to explain data) and partially because economics lacks models with anything approaching what scientists would call "empirical accuracy" (and Foley's work doesn't seem to address empirical data much either).

...

Friday, April 13, 2018

JOLTS forecasts and leading indicators update

The latest JOLTS data is out today, so it's once again time to see how the forecasts are doing (last month had a lot of data revisions). The model of the "Great Recession" showed that JOLTS hires were a leading indicator of that recession, however an attempt to glean data from the early 2000s recession had JOLTS openings as the leading indicator (which should be taken with a grain of salt because the time series starts mid-recession making the timing estimates uncertain). If we are seeing the leading indicators of a recession with the latest data, then it looks like job openings are the one to watch:


The data is deviating from the forecast that assumes no recession, and the counterfactual recession shock is (still) showing a likely downturn with the latest data. I might even go out on a limb and say the 2019 recession is underway — having begun sometime this year. However the other JOLTS measures remain consistent with the no-recession forecast, only hinting at a future recession by a negative bias to the error:


The Beveridge curve (of unemployment versus job openings) is another way to represent the deviation in the job openings data (unemployment per the links above is a lagging indicator by almost a year):


There is another "Beveridge curve" (now I'm just referring to the whole class of relationships between labor market measures as "Beveridge curves", which I believe is not standard in economics but would be the kind of thing that physicists might say (e.g.)) that was inspired by Nick Bunker's article anticipating the data release from today. While I don't believe in the way he frames the data (his description of a declining "vacancy yield" in terms of possibly changing conditions is, in the dynamic equilibrium model, a normal result of equilibrium) his look at hires and vacancies prompted me to look at the two measures together:


Since hires and openings (vacancies) are positively correlated, this results in a proportional relationship between the two rates (a negative correlation between openings and unemployment results in inverse proportionality). Recessions can cause the economy to move from one equilibrium (gray line) to another. This measure probably won't be as good of a representation because the timing of recession shocks (green and purple dots) are closer (a few months) than for openings and unemployment rate (almost a year in the previous graph) and the series are correlated leading to less of a dynamic range and more "backtracking" along the paths (i.e. both fall in a recession).

Overall, the picture appears to be a looming recession with job openings (vacancies) showing the first signs — but also the only signs.

...

PS The details of the model are described in my paper up at SSRN.

Friday, April 6, 2018

Employment situation forecasts compared to latest data

Another month, and another 4.1% unemployment rate. The latest unemployment situation data is available, and it's all consistent with the forecasts. The unemployment rate is consistent with a forecast from January 2017 (so over a year of data):


Here is the same forecast compared to forecasts from the FRBSF and the FOMC (click to enlarge):


Funny enough the old FOMC forecast from December 2016 is doing better than the most recent one from their March meeting.

Here are the two models of the prime age labor force participation (with and without a shock, as discussed here), as well as the novel "Beveridge curve" (at the same link):


Click to enlarge.

Wednesday, April 4, 2018

Labor force decline in the US relative to other OECD countries is mostly about women


There's a recent article from the FRB SF on economic growth prospects that contains the chart above with the following discussion:
This chart compares the percentage of prime-age workers in the labor force in Germany, Canada, the United Kingdom, and the United States. In these other advanced economies, labor force participation of prime-age workers has increased overall and now stands far—several percentage points—above the rates observed in the United States.
Which raises the question—why aren’t American workers working?
The answer is not simple, and numerous factors have been offered to explain the decline in labor force participation. Research by a colleague from the San Francisco Fed and others suggests that some of the drop owes to wealthier families choosing to have only one person engaging in the paid labor market (Hall and Petrosky-Nadeau 2016). And I emphasize paid here, since the other adult is often staying at home to care for house or children, invest in the community, or pursue education. Whatever the alternative activity, some of the lost labor market participation seems related to having the financial ability to make work–life balance choices.
I went to the OECD data and found that the stagnation in labor force participation in the US compared to other countries is almost entirely a phenomenon of female labor force participation:


US female labor force participation increases until the late 90s, and then stagnates (becoming correlated with male labor force participation). In the other countries shown, female labor force participation is mostly still increasing. What caused that?

I've mentioned before that it is not out of the question that increasing female labor force participation was involved in the surge of inflation peaking in the 70s, and that the Volcker Fed's actions worked by arresting that increase. However, given that there hasn't been a subsequent recovery, it is more likely that female labor force participation in the US just reached a new equilibrium — an equilibrium that is different from the equilibrium in Canada, Germany, or the United Kingdom.

One glaringly obvious culprit is the miserliness of family leave provisions in the US. The FMLA of 1993 was passed as the issue made its way to the political forefront in the 90s (likely due to labor force participation — both total and female — reaching its highest levels in history), but the provisions of the FMLA are laughable when compared to those of other countries (where many improvements to and beyond ILO standards were made in the 90s and early 2000s [pdf]). Women's labor force participation thus stagnated in the US, while policies allowed it to continue to grow in Canada, Germany, and the UK.

That story is hardly definitive, and there could be many other factors (for example, parts of the US are more like Western Europe in terms of social institutions while others are not leading to an admixture of different "cultures" meaning the 'equilibrium' participation rate being essentially an average of the UK and, say, Turkey). The story from the FRBSF that increased wealth in the US has lead to one parent staying home is not entirely implausible. I haven't fully immersed myself in the literature here, so this should be considered more formulating the question than providing an answer. The main point is that recent labor force participation stagnation in the US appears to be primarily due to women's labor force participation stagnating.

Tuesday, April 3, 2018

What about those markets?

Two of the more hubris-laden forecasts I've made are for the stock and bond markets, specifically the S&P 500 (a dynamic information equilibrium model) and the 10-year Treasury rate (a basic information equilibrium model). The latest gyrations of both are well within the expected model error. Note that the 10 year forecast is the forecast of the green line which represents the trend around which the data fluctuates — by about 1.3 percentage points RMS (this error is shown as a lighter green band) — while the S&P forecast shows the 90% confidence bands for the data. Click to see the full resolution versions.


For some additional perspective, here is the longer run for both (click to enlarge):


Monday, April 2, 2018

Overshooting: bitcoin case study

I've been tracking the bitcoin exchange rate using a dynamic information equilibrium model since last year [1]. While I found that the model is useless for forecasting, it can still provide decent post hoc descriptions of the data:


Part of the impasse to being useful as a forecasting model is that the data shows signs of both a) large shocks, and b) "overshooting". Here we can see two forecasts (one in December, the other from the beginning of March [2]):


The dynamic equilibrium model itself is just a prediction that in the absence of non-equilibrium shocks the slope is constant (as you can see with the parallel lines). This constant slope has remained a good description of the bitcoin exchange rate since the late 2017 shock.

The bitcoin data, like some other economic data analyzed with the dynamic equilibrium model (unemployment), appears to have what in physics is called a "step response": "ringing" that occurs when a sharp shock hits the system. The fundamental reason for this "ringing" is that the system doesn't have sufficient "bandwidth" to support the infinite number of frequencies required to describe a sharp shock (in an economic system, both units of time as well as the number of economic agents determine this [3]).

However there is also a problem with fitting the underlying logistic function shock model in that it can both undershoot and overshoot. I put together some simulated data using a step response function and added an AR(2) process for noise. As the data comes in, the logistic function fit first undershoots and then overshoots the underlying "step" as I've noticed before in e.g. unemployment data:


As of yet, I don't know if there is a solution to this problem (and there may not be as estimating parameters of exponentials is always difficult).

...

Footnotes:

[1] Here is the evolution of that forecast:


[2] Note that the March forecast was predictive of the data for the next month (at the top of the post). As long as we're not in the middle of a non-equilibrium shock, the model is a good description of the data.

[3] One possible reason for the disappearance of the step response in unemployment data is a combination of an increased number of people in the labor market along with the flexibility in time periods people can be employed — in the past, you might have had to start on a Monday or even the 1st of the month because of firms' payroll schedules. Workers wouldn't e.g. work 3 days, then be unemployed for 1 day, and then work again for 10 days (or if they did, they didn't consider themselves "unemployed" during that 1 day).

Sustained growth?

First, the reaction of wages to the Black Death (around 1350-1450) is much smaller in terms of annual wages compared to day wages. ... 
Second, and probably most noticeable, is the onset of sustained growth in annual earnings much earlier than the actual Industrial Revolution. Both the GDP per capita and the annual earnings series [begin] to accelerate around 1650. ... 
That increase predates even the most aggressive dating of the industrial revolution in terms of specific technologies ...
That is from Dietrich Vollrath's great new blog post on (estimated) economic growth in England from 1260-1850. A new time series for income from Jane Humpries and Jacob Weisdorf calls into question some traditional interpretations of economic history. I thought I'd try the dynamic equilibrium model on the new time series to see if it is possible to tease any further information from it.


I show the model fit with the non-equilibrium transitions on the graph (three positive, and one negative). The story largely corrobborates Vollrath's contention that a sustained growth 'take-off' pre-dates the industrial revolution. In fact, the dynamic equilibrium model indicates the rapid growth of of the 17th and 18th centuries begins in the early 1600s. The latter two shocks roughly correspond with shocks to estimated energy consumption in the US (asterisks). A more likely interpretation is that the initial 'sustained' growth was due to colonization of the Americas (the burst almost perfectly fitting between the founding of Jamestown and the American revolution) and the slave trade (tentatively marked here by colonization of Barbados and Wilberforce's abolition). However 'sustained growth' is not the right description for a slavery and colonization-based economy; as the industrial revolution comes along, this growth was fading.

The black death still seems to be the trigger for the increase in real income in the 14th and early 15th century in this new time series, but there is a negative shock in the 16th century that doesn't correspond to any bad news that I can see in the economic history. It actually corresponds to the "Elizabethan era", which is hailed as a golden age of England. This makes me think that this is due to a nominal shock rather than a real one. The most likely culprit is the "price revolution" (see also here) and the accompanying inflation due to the Spanish plundering the New World — real income is down because of a shock to inflation without an accompanying shock to nominal growth.

The overall picture I want to leave with is that "sustained growth" does not seem to be the best and only interpretation of what we think of as the modern era of economic growth. In fact, rather than an era of sustained economic growth, what we may have are a series of nearly overlapping large shocks (colonial era in the 1600-1700s, railroads in the 1800s, the world wars 1900-1940s, and women entering the workforce 1970s, see here for these events in the UK inflation time series). This means that unless some new non-equilibrium shock is in the future, we cannot expect sustained economic growth.

...

Update 4 April 2018

Per David Glasner's comment below, I did want to clarify that by "sustained growth" I mean the rapid sustained growth of the modern era of industrialization (1700s to the 1900s). In the absence of non-equilibrium shocks, the dynamic equilibrium picture indicates sustained real US growth of about 2.4% per year.

Thursday, March 22, 2018

Effective information in complex models of the economy

Feedbacks in the economy (section)

Let me first say this is a great post from Sri Thiruvadanthai, and I largely agree with its recommendation to aim towards a resilient economic system rather than a stable one. And I would also agree that the idea that a single interest rate can stabilize the system (partially) pictured above from Sri's blog post is at best idealistic (at worst foolhardy) — if we viewed this system as a blueprint for a mathematical model. A mathematical model this complex is likely intractable as well, above and beyond using a single interest rate to stabilize it.

However, when I saw the diagram another diagram from Erik Hoel appeared in my head; I've placed Sri's diagram alongside Erik's:


Now it's true that Erik is talking about simple Markov chain models, but that might be interpreted as the limiting case of the information contained in asset prices, credit markets, economic activity, and benchmark rates [1]. In the limiting case, the "effective information" in this model for forming a causal explanation is basically zero. Another way to put it is that given enough feedbacks and connections between observables, your model becomes too complex to be useful to explain anything.

Now Erik's paper motivates so-called causal emergence: just as there are local minima of effective information, there are local maxima and we can think of the separation between these local maxima being related to scales in the theory. We understand chemistry at the atomic scale, but we understand biology at the cellular scale. Erik's conjecture is that this is a general property of causal descriptions of the universe from quarks to quantitative easing.

Now I understand this is just my opinion, but this is why I don't think a lot of "this is how the banking system actually works" will help us understand macroeconomics. Effective information and causal emergence is always at the forefront of my mind when I see descriptions like this (click to expand):


Such a model might well capture the details of the system, but might yield no insight as to how it actually works. Knowing what every neuron does could capture the phenomena of a brain system, but it probably won't yield answers to questions about consciousness or even how humans recognize objects in images [2].

And since the "emergent" but approximate descriptions with higher effective information at the higher scale don't have a 1-to-1 relationship with the model at the lower scale (they cannot because that 1-to-1 relationship could be used to translate one to the other implying that the effective information of the models at the two scales would be equal), there is no reason to expect the models to behave in ways interpretable in terms of the lower scale sub-units.

And now I come back to Sri's contention that changes to a single interest rate is unlikely to stabilize the system diagrammed above — especially if we think of interest rates in terms of the causal model above where we make some loose associate between raising interest rates and tightening monetary policy and damping economic activity.

I make the rather contrarian assertion in my blog post about monetary policy in the 80s that the increase in interest rates and "decisive action" from the Volcker Fed may well have mitigated the first 80s recession, but then the same stance caused the second. This is of course makes no sense on the surface (raising rates are both good and bad for the economy), but the feedbacks and strong coupling in Sri's diagram mean the system is probably so complex as to obliterate an obvious 1-to-1 relationship between the discount rate and economic activity.

However, it might have an effective description thought the causal emergence of politics and "Wall Street opinion". Volcker's "decisive action" in raising interest rates/targeting monetary aggregates was considered "good" because the government (Fed) was "doing something". The recessionary pressure ebbed, and the first recession faded. In the same way, quantitative easing might well have had "symbolic" effect in stopping the panic involved in the 2008 financial crisis. Volcker's and Bernanke's "decisive actions" might well have no sensible interpretation in terms of the underlying complex model at the lower scale. But at the macro scale, they may have helped.

That's also how Volcker doing almost exactly the same thing again about a year later could cause a recession. Instead of being seen as "decisive action", the second surge in the discount rate was seen as the shock to future prices it was intended to be. In the underlying model, firms laid off workers and unemployment rose dramatically.

There's no single interest rate that stabilizes Sri's system, but one interest rate could be used as a focus for business sentiment and a complex signal of information.

Now there is a danger lurking in this kind of analysis because it leaves you vulnerable to "just so" stories at the higher scale, especially if you try an interpret things in terms of the complex underlying model. That's why models at the higher scale need to be constructed and compared to data. While we have physics models of protons, neutrons, and electrons, and use them to model atoms, we don't then say that chemistry involves complex interactions of atoms and use that to produce "just so" stories. We find empirical regularities in chemistry which have their own degrees of freedom like concentration and acidity. In some cases we can make direct connection between atoms and chemical processes, but other chemical processes are so complex that they're intractable in terms of atoms.

This also doesn't mean the lower scale model isn't useful. Sometimes the insight comes from the lower scale model. Sometimes you need to understand parts of it to do some financial engineering (such as Sri's contention to focus on making the system more resilient — solutions might come in terms of specific kinds of transactions or for particular assets). The "shadow banking system" comes to mind here; looking at the details might point out a particular danger. But the macro model might not need to know the details and interpreting the financial crisis in terms of a run on the shadow banking system with a Diamond-Dybvig model will have more effective information for macro policy than the details of collateralized debt obligations.


Footnotes:

[1] We can think of the nodes in that network themselves made up of more complex models as in another paper from Erik:


[2] There are similar contentions with machine learning where a system might be able to recognize any picture of a dog, but we won't really understand why at the level of nodes.

Wednesday, March 21, 2018

Fed revises its projections (again)


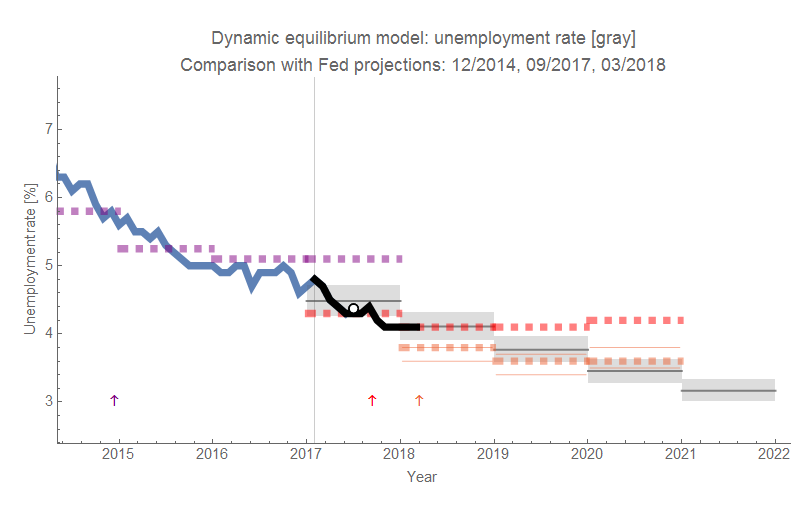
As unemployment continues to fall, the Fed has once again revised its projections downward [pdf]. The latest projection is in orange (the limits of the "central tendency" are now shown as thin lines). I added a white point with a black outline to show the 2017 average (which was exactly in line with the dynamic information equilibrium model from the beginning of 2017 as well as in line with the Fed's projection ... from September of 2017 with more than half the data for 2017 already available). The vintage of the Fed forecasts are indicated with arrows. The black line is the data that has come in after the dynamic equilibrium forecast was made.

One thing I did remove from this graph was the "longer run" forecast that is nebulous. I had put them down as happening in the year after the last forecasted year. But the Fed is wishy-washy about it, and I thought they were wrong enough already without adding in some vague "longer run" point. 


It's the 80s!

It's the 80s!
Do a lot of coke and vote for Ronald Reagan!
 
Mystery Science Theater 3000
David Andolfatto had a post asking the title question: What anchors inflation? The post represents a run-through of the monetarist view that the Volcker Fed anchored expectations through aggressive, manly credibility at the end of which Andolfatto asks whether fiscal policy had anything to do with it.

Now my contention is that in general from the 60s through the 90s a demographic wave of women entering the workforce was behind the existence of the Phillips curve so that recoveries and recessions were marked by rising and falling inflation. When this demographic wave crests in the late 90s, inflation and unemployment cease to have a relationship (because recoveries do not pull people into the labor force as they did before) resulting in our present day "price stability".

But I also believe that the actual process of recessions are largely social phenomena that can potentially be affected in their timing, severity and duration by political actions. That said: the 80s were complicated.

While Andolfatto claims that Fed policy under Volcker led to the recession, the recession (in terms of unemployment) had already begun in mid-1979 (first gray band in the graph below):


Additionally, there seem to be leading indicators ahead of the surge in unemployment (such as JOLTS measures unavailable at the time, or per a recent paper conceptions) so the recession had probably been building for several months before the unemployment rate spiked.

Oddly, a case can be made that the Fed's actions (based on the shock to the monetary base that Andolfatto uses) may have actually temporarily arrested the recession as the shock is ending as the shock to the monetary base is beginning. while this might be weird for a monetarist theory of recessions, it isn't weird for a social theory — the Fed was making announcements and people thought that something was being done. In the same way QE might have worked as symbolic action, Volcker's "decisive action" might also have symbolically alleviated fears.

Now some theories suggest (including the Wikipedia article on the tax cuts) that the "double dip" recession was caused by the deficit ballooning under the ERTA driving up interest rates. However, the ERTA is signed when the second shock is already underway and doesn't take effect until later anyway. It is possible that the deficits actually arrested the progress of the second shock or even lead to the third positive shock to employment in 1983 (this third shock may also be the rebound of the step response — a ripple following on the heel of the previous shock). The ERTA was also phased in, but some of the tax cuts were reversed with TEFRA (selected timings are indicated on the graph in red text/arrow).

Again, in general there seem to be indicators (e.g. JOLTS, as mentioned above) that lead spikes in unemployment by several months meaning this second recessions causes could go as far back as 1980.

Another possibility to consider is that the downturn in base growth was caused by the factors behind the recession, not monetary policy. But as I show the monetary base adjusted for reserve requirements (dashed line) takes a hit at the beginning of 1979. To try and disentangle the different timings, I looked at the currency component of the base, which also shows a downturn beginning in early 1979:


This expanded graph also shows a fourth shock to unemployment (or part of the continuing step response ripple), and a second shock to monetary base growth in 1984 (following the second hit to unemployment). The currency component shows a shock beginning even earlier than the recession shock (purple vs red bands). This coincides with the small shock to the adjusted base. However if this is used as evidence that monetary policy caused the recession, it completely discounts the entire "Volcker Fed" story as Volcker wasn't even nominated until about 6 months later in July 1979.

But there is other evidence that the recessionary indicators were building far before the downturn(s) in monetary base growth. The yield curve inverts in late 1978, and the stock market falls more than 10% in the last two weeks of October 1978. Oil prices are raised by two OPEC countries in early 1979.

All indications point to the first 1980s recession being a "normal" one caused by essentially a general downturn in business optimism. The cause of the second one is harder to pin down but is plausibly the one caused by the Volcker Fed's attempt to control inflation. One story told (e.g. on Wikipedia) is that high interest rates took a toll on housing [1] and manufacturing. There is some evidence of this: the discount rate drops after the first recession is declared to be over, however soon after the Fed begins to raise the discount rate and the effective Fed Funds rate (EFF) launches to over 20% around the time that Reagan takes office. With this spike, construction jobs cease their recovery and plummet again.

If the mechanics of the Phillips curve are as I described earlier, then the Fed did control inflation a bit by throwing people out of work. This inflation would begin to return  as soon as the recovery got underway; it was only the end of the demographic transition by the 90s that brought down trend inflation. In this model, the trade off was between a trend of slowly falling inflation and a temporary spell of rapidly falling inflation plus mass unemployment amid a trend of slowly falling inflation. It's possible the Fed's action arrested women's increasing labor force participation, but this seems unlikely as it hasn't resumed as the effects of the 1980s recession fade into history (i.e. the current "equilibrium" of ~10 percentage points higher employment population ratio for men than women more likely represents a new social or technology-driven [2] equilibrium).

So in the end, the 80s recessions are a jumble of "normal" factors and a possibly unethical macroeconomic experiment by the Fed based on incomplete and most likely incorrect theories. But the best story in terms of causality is that there was a normal short recession building in late 1978 that becomes the one NBER says started in January of 1980. As this recession begins to fade without bringing down inflation enough, the Fed hikes the discount rate initially to 13%, and then to 14% until employment starts to spike again. NBER says this one started in mid-1981, but in fact it started to get underway around the time the discount rate heads up to 13% in early 1981. Lower inflation was acheived via mass unemployment, but that lower inflation would have arrived by the late 80s or early 90s anyway due to the fading demographic shift. The end of that demographic shift is what appears to have "anchored" inflation, not Fed action or fiscal policy.

PS I used this paper [pdf] and this history article from the Fed for some of the dates and news events.

...

Footnotes

[1] I have a personal anecdote from this period. My parents moved to Houston in 1979 when my dad got a job in the oil industry. We spent the first few years in an apartment and two rented homes until they finally were able to get a mortgage for a house in 1983 when interest rates came back down a bit.

[2] Per this discussion, it is possible that post-war household production technology development was behind a shift of women into the labor force.