Last year when the Fed raised short term interest rates from a range between 0 and 25 basis points to a range between 25 and 50 basis points, I predicted (based on the information equilibrium [IE] model) that the monetary base (the path labeled C in the graph below) would start to fall (I had no idea how fast) relative to no change (the path labeled 0 in the graph below). That turned out to be a pretty successful prediction. The Fed now stands poised (according to Fed watchers like Tim Duy) to raise rates again after its December meeting to a range between 50 and 75 basis points. What will be the impact? What can we learn about the IE model?
The key question is whether the monetary base will start to fall faster or not. The IE model predicts a lower equilibrium monetary base for the range 50-75 basis points (labeled C' in the graph below). If the distance to the equilibrium matters, then the rate of fall should accelerate a bit. However it is possible the drift rate has to do with factors other than the distance to the equilibrium (such as volume of trading) which might be independent of the distance to the equilibrium. I illustrated both of these paths. The solid line is time series model forecasts based on the Mathematica function -- which auto-selects an ARIMA process -- for weekly source base data after the Dec 2015 announcement. The dashed line is a possible accelerated path that is simply adjusted to cover the new distance (to the new equilibrium C') a year later. The RMS error is shown as a yellow region (and blue for the period after the original estimate of reaching the equilibrium C).
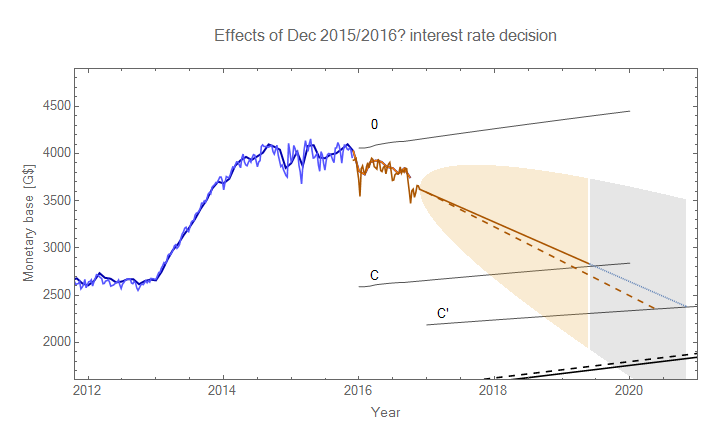
Data after the December 2015 Fed meeting is shown in orange (both weekly source base and monthly adjusted monetary base). The expected paths (assuming immediate adjustment) are shown in gray as 0 (no change), C (25-50 bp after 2015), and C' (50-75 bp after 2016). The black line represents zero reserves and the dashed black line represents the average 40 billion in reserves from 1990 to 2008.
* * *
The model is described in more detail in my paper.
Here's a cool 3D visualization of the model.
Some additional discussion about the December 2015 prediction is here.
Here is the IE model's performance compared with DSGE and other models.
Here are a series of interest rate forecasts compared with the Blue Chip Economic Indicators (BCEI) forecast. The BCEI forecast has continued to be incorrect -- much worse than the IE model.
No comments:
Post a Comment
Comments are welcome. Please see the Moderation and comment policy.
Also, try to avoid the use of dollar signs as they interfere with my setup of mathjax. I left it set up that way because I think this is funny for an economics blog. You can use € or £ instead.
Note: Only a member of this blog may post a comment.