Imagine a large number of cars forever circling around a very large roundabout. Initially they are all going the same speed, and are evenly spaced. What happens if one car slows down temporarily?
This morning I remembered the post (mostly because of this and related discussion) and was inspired to look at the story as an entropy problem. I considered 5 cells where points (think of them as money) were randomly allowed to move counterclockwise one cell -- also, the fifth cell is next to both the fourth and first cell (i.e. periodic boundary conditions). Update 3:50pm: here is a picture of the 5-cell roundabout ...
.png)
If we start with all the money in the first cell (above the 3 o'clock position), the average configuration moves toward the maximum entropy distribution (equal amounts of money in each cell):
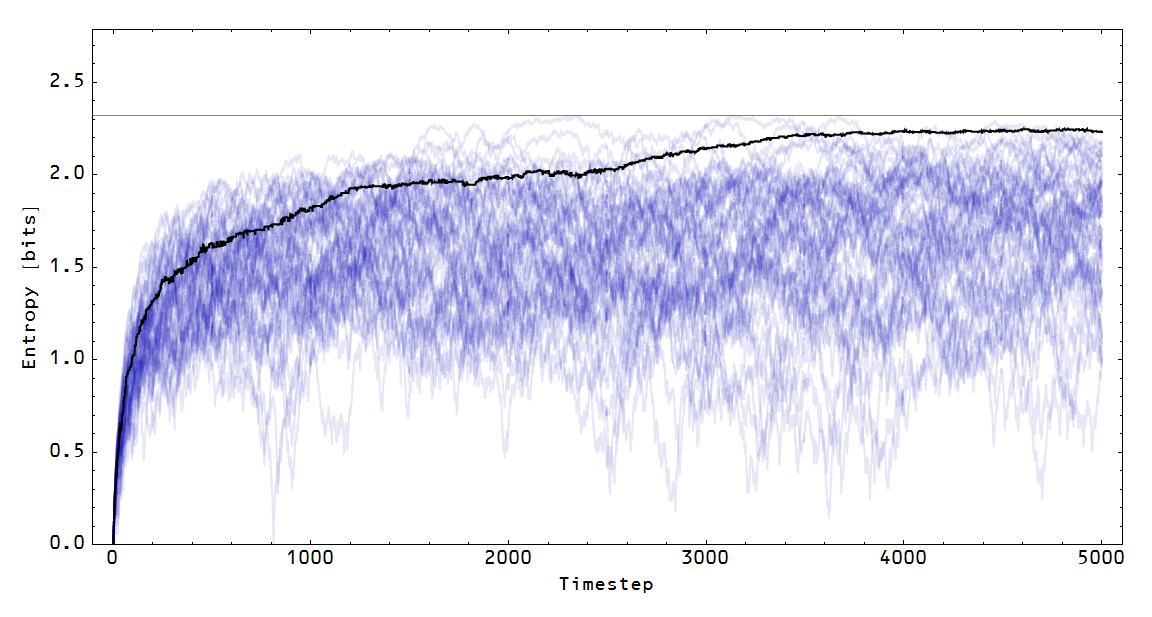
Note that the blue paths represent the entropy of a particular configuration (in the Monte Carlo simulation), while the black line represents the entropy of the average configuration. You can watch this in the following animation:

Rowe wanted to consider a pile-up (traffic jam) on this Wicksellian roundabout. I started with a maximum entropy configuration and added a period where the first cell (the one that starts with all the points in the picture above) increased its demand for money. During that period, that cell doesn't let a point leave its cell. Here is the entropy of the average configuration in that case:

The entropy takes a hit, and then starts heading back towards the maximum entropy distribution. Here is an animation for that case:

What does a loss in entropy mean for an economy? A fall in entropy is a fall in output. What the picture above shows is a recession.
What is interesting is that a decrease in the demand for money in the first cell also causes a recession. I modeled this by making it more likely that the first cell gives up one of its points. The result is similar:

And here is the animation:

The effect is less pronounced because in this case the first cell only affects the distribution using points that are in its own cell. In the first recession case, the first cell is interrupting the flow from all five cells. What a decrease in the demand for money in the first cell does is create an effective increase in demand in the second cell (it ends up with more money than maximum entropy would indicate).
I like your graphics...
ReplyDeleteI'm thinking lately about new monetarist models in general. although the recent levine and williamson models use directed search, the kyotaki and wright 89 and 93 papers and lagos and wright 2005 use random bilateral matching.
In these models, although equilibrium conditions require utility maximization and rational expectations...fundamentally, the search mechanism implicitly assumes maximum ignorance as far as who an agent will get matched up with.
the equilibria are usually not pareto efficient, so im not so sure why it is essential to assume utility maximization and/or rational expectations anyway...probably there is a straightforward way to relax those assumptions towards a fuller max entropy allocation...and get essentially the same results
Thanks for the references -- I will try to read those papers and see if there is anything an entropy approach could add. I had previously looked at matching e.g. here:
Deletehttp://informationtransfereconomics.blogspot.com/2014/03/information-transfer-and-cobb-douglas.html
I imagine your intuition is correct and you could relax utility maximization to entropy maximization and get similar results.
ok, i know at least in lagos and wright they exogenously impose generalized nash bargaining solutions for single coincidences of want meetings...in double coincidence meetings, id expect that there is no need to resort to the information signal, since both agents have what they want in front of them immediately...
DeleteI note this in particular because the single coincidence of wants solution has a cobb-douglas-like form like you are talking about in the link
essentially, the exponents there are the exogenous bargaining power of a potential buyer vs the seller...what would be the implications of instead deriving that form from the information model?
The exponents in the information model are related to the relative number of bits required to identify a state -- basically the number of options for a box on each side. Options are one way to have bargaining power. In that sense, they could potentially be related ... I'd have to go through the math, though.
DeleteI'd have to look more closely to see other implications ...
Hi, Jason.
ReplyDeleteI don't remember seeing this before. Interesting how the speedup causes less entropy loss than the slowdown. :) A couple of questions, if you don't mind.
1) I assume that different degrees of slowdown and speedup cause the same entropy loss. How about a few examples?
2) What happens with a Keynsian policy for cell #1? For instance, suppose that there are upper and lower speed limits, such that if the average speed of cars in cell #1 exceeds the upper speed limit it slows them down, and if the average speed limit is speeds them up? Another possibility involves "fiscal policy", such that some cars are government cars, and they speed up or slow down in countercyclical fashion depending upon the average speed of the other cars.
Thanks.
Sorry I didn't get to this before -- I think I was on a business trip that week so that's probably why.
DeleteRegarding 1) actually you could change the rates of transfer between cells (right now it is 1 per time step) and it would change the temporal structure of the shock. It would look vaguely similar, and the above was good enough for toy model purposes.
Regarding 2) you could add to one of the deficit cells or you could add to all of the cells and it would increase the entropy.
1) In the 3rd figure down (1st gif), the blue line is an average I presume? I looks different in character from the blue lines in the figure just above it. Or is that blue line directly reflecting the five cell ring animation just to it's left? Same question for the other two similar gifs.
ReplyDelete2) At each time step, I imagine for each point you draw a number from some kind of non-negative probability distribution, which describes the angle it traverses counterclockwise around the circle? Like an exponential density function perhaps?
3) For figures 5 and 6 (last two non-gifs), the average does not visually appear to be the average of the blue curves, especially on the right-hand side of the plots. Is thinking of them as the average of the blue curves the wrong way to think of them?
1) yes, sort of. See 3.
Delete2) there's actually a finite probability to select a cell and transfer a unit to the next cell. Repeat.
3) it's the entropy of the average distribution,not the average entropy. A bit different.