Showing posts with label prediction. Show all posts

Friday, September 18, 2015

Prediction aggregation, redux

Here's a new post that aggregates predictions (here is the previous one).

_________________________________

Prediction: multiple indicators

https://informationtransfereconomics.blogspot.com/2015/09/predictions-doing-well-after-18-months.html
https://informationtransfereconomics.blogspot.com/2016/04/celebrate-this-blogs-birthday-with.html
[US core CPI inflation, RGDP, interest rates from 2014 to 2016 = 2 years]
updated 04/2016

Status: Successful

_________________________________

Prediction: interest rates

https://informationtransfereconomics.blogspot.com/2015/08/comparison-of-interest-rate-predictions.html
https://informationtransfereconomics.blogspot.com/2016/05/doing-economists-work-only-better.html
https://informationtransfereconomics.blogspot.com/2016/11/the-surge-in-10-year-rate.html
https://informationtransfereconomics.blogspot.com/2017/02/monetary-base-and-interest-rate.html
https://informationtransfereconomics.blogspot.com/2017/08/who-has-two-thumbs-and-really-great.html
https://informationtransfereconomics.blogspot.com/2017/10/10-year-interest-rate-forecasts-in-us.html
[US long term interest rates from 2015 until 2025 = 10 years]
updated 10/2017

Status: Ongoing


_________________________________
https://informationtransfereconomics.blogspot.com/2015/07/comparing-ngdp-predictions-with-results.html
https://informationtransfereconomics.blogspot.com/2016/01/predictions-and-prediction-markets.html
https://informationtransfereconomics.blogspot.com/2017/01/updating-ngdp-path-prediction.html
https://informationtransfereconomics.blogspot.com/2017/04/update-to-predicted-path-of-ngdp.html
https://informationtransfereconomics.blogspot.com/2018/01/another-successful-forecast-ngdp.html
[US NGDP from 2015 to 2018 = 3 years]
updated 01/2018

Status: Successful

_________________________________

Prediction: Inflation versus DSGE model

http://informationtransfereconomics.blogspot.com/2015/08/latest-pce-inflation-data.html
http://informationtransfereconomics.blogspot.com/2015/10/core-pce-inflation-update.html
http://informationtransfereconomics.blogspot.com/2015/11/speaking-of-math.html
http://informationtransfereconomics.blogspot.com/2016/02/model-forecast-update-core-pce-inflation.html
http://informationtransfereconomics.blogspot.com/2016/04/update-to-2014-it-model-inflation.html
http://informationtransfereconomics.blogspot.com/2016/08/ie-vs-ny-fed-dsge-model-update.html
http://informationtransfereconomics.blogspot.com/2017/01/an-inflation-forecast-comparison-update.html
https://informationtransfereconomics.blogspot.com/2017/11/comparing-my-inflation-forecasts-to-data.html
https://informationtransfereconomics.blogspot.com/2018/01/losing-my-vestigial-monetarism.html[US core PCE inflation; comparison with NY Fed DSGE model]
updated 01/2018

Status: Rejected ☹


_________________________________

Prediction: EU inflation

http://informationtransfereconomics.blogspot.com/2015/09/correctly-predicting-eurozone-lowflation.html
http://informationtransfereconomics.blogspot.com/2016/04/blog-birthday-week-continues-another.html
[EU inflation (HICP) sans energy and seasonal food]
updated 04/2016

Status: Successful

_________________________________

Prediction: PCE inflation versus corridor model

http://informationtransfereconomics.blogspot.com/2014/08/smooth-move.html
http://informationtransfereconomics.blogspot.com/2016/02/model-forecast-update-core-pce-inflation.html
http://informationtransfereconomics.blogspot.com/2016/04/update-to-2014-it-model-inflation.html
[US core PCE inflation, comparison with David Beckworth's corridor model -- to 2020]
updated 04/2016

Status: Ongoing

_________________________________

Prediction: Canadian inflation

http://informationtransfereconomics.blogspot.com/2015/06/celebrating-500-posts-with-predictive.html
http://informationtransfereconomics.blogspot.com/2017/02/worthwhile-canadian-prediction-comes.html
[Canada CPI inflation (undershooting)]
updated 02/2017

Status: Successful


_________________________________

Prediction: Japanese price level

http://informationtransfereconomics.blogspot.com/2015/07/model-prediction-holding-up-for-japan.html
http://informationtransfereconomics.blogspot.com/2016/01/updates-to-some-ongoing-forecasts.html
http://informationtransfereconomics.blogspot.com/2016/01/the-bojs-macroeconomic-experiment.html
http://informationtransfereconomics.blogspot.com/2016/02/it-model-forecast-update-for-japan.html
http://informationtransfereconomics.blogspot.com/2016/08/japan-lack-of-inflation-update.html
[Japan "core-core" price level and inflation to 2020/2025]
updated 08/2016

Status: Ongoing


http://informationtransfereconomics.blogspot.com/2017/03/the-mystery-of-japans-inflation.html
http://informationtransfereconomics.blogspot.com/2017/07/a-few-forecast-updates.html
[Japan "core-core" price level to 2020 with dynamic equilibrium model]
updated 07/2017

Status: Ongoing


_________________________________

Prediction: UK exchange rate

http://informationtransfereconomics.blogspot.com/2015/06/exchange-rates-and-irrational-markets.html
http://informationtransfereconomics.blogspot.com/2016/04/blog-birthday-week-continues-another_29.html
[Euro GBP (€-£) exchange rate]
updated 04/2016

Status: Successful

_________________________________

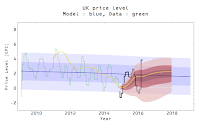
Prediction: UK inflation

http://informationtransfereconomics.blogspot.com/2015/06/forecasts-from-new-bank-of-england-blog.html
http://informationtransfereconomics.blogspot.com/2016/05/update-of-uk-inflation-prediction.html
[UK CPI, comparison with the Bank of England]
updated 05/2016

Status: Ongoing

_________________________________

Prediction: monetary base/interest rates

http://informationtransfereconomics.blogspot.com/2015/12/zirp-is-over-let-experiment-begin.html
http://informationtransfereconomics.blogspot.com/2016/01/post-hike-monetary-base-projection.html
http://informationtransfereconomics.blogspot.com/2016/01/the-10-year-treasury.html
http://informationtransfereconomics.blogspot.com/2016/02/the-long-and-short-of-interest-rates.html
http://informationtransfereconomics.blogspot.com/2016/03/interest-rate-and-monetary-base-updates.html
http://informationtransfereconomics.blogspot.com/2017/02/monetary-base-and-interest-rate.html
http://informationtransfereconomics.blogspot.com/2017/02/monetary-base-update.html
http://informationtransfereconomics.blogspot.com/2017/07/a-few-forecast-updates.html
[US monetary base]
updated 07/2017

Status: Ongoing

 
_________________________________

Prediction: lag model of CPI inflation

http://informationtransfereconomics.blogspot.com/2015/11/cpi-inflation-predictions-and.html
http://informationtransfereconomics.blogspot.com/2016/01/updates-to-some-ongoing-forecasts.html
[US core CPI and PCE inflation to 2018]
updated 02/2017 (at 11/2015 link)

Status: Rejected (t < 1 year) ☹
Status: Ongoing, (t > 1 year)


_________________________________

Prediction: Swiss CPI 

https://informationtransfereconomics.blogspot.com/2015/01/floating-swiss-franc-wont-change-price.html
https://informationtransfereconomics.blogspot.com/2016/02/another-win-for-it-model-switzerland.html
[Swiss CPI]
updated 02/2016

Status: Successful 

_________________________________

Prediction: US rental vacancies

https://informationtransfereconomics.blogspot.com/2017/04/dynamic-equilibrium-rental-vacancy-rate.html
[US rental vacancies]
updated 4/2017

Status: Ongoing


_________________________________


Let me know if I've forgotten any ...

Thursday, September 17, 2015

Correctly predicting Eurozone lowflation

Paul Krugman mentions Eurozone lowflation today ...
So how’s [the Eurozone] going? Terribly. Despite QE, euro area core inflation is stuck below 1 percent.
Basically, as I predicted back in January [note: this was on 8 Jan 2015, even before Draghi's announcement of additional QE on 22 Jan 2015] of this year.

Here's an updated graph of the information equilibrium model with the new data:


Wednesday, September 9, 2015

Predictions doing well after 18 months

69 days into 2014, and less than a year since I started this blog I (and my hubris) decided to try to predict the next two years of macroeconomic indicators: core CPI, short (3-month) and long (10-year) interest rates, RGDP and the unemployment rate. OK, the last two weren't really model predictions -- RGDP falls out of the NGDP projection and the core CPI (so it's not really independent of the CPI prediction) and the unemployment rate model was actually just some speculation and a "metastability" model I invented in the original prediction post. There have been two previous updates (one, two).

The model took as input some ('theory-free') simple quadratic extrapolations of the data from 2013 Q1-Q4 out to the end of 2016. I only later came up with the NGDP-M0 path which would turn NGDP into a predicted value.

Since there are some new readers out there, I thought I'd write up the details of the procedure so you don't have to go hunting around the blog. The basic models appear in the draft paper. All of the data is from FRED.

Inputs:

  • NGDP 1960 Q1 to 2013 Q4 (GDP)
  • M0 1960 Q1 to 2013 Q4 (MBCURRCIR)
  • MB 1960 Q1 to 2013 Q4 (BASE)

Model fit to price level: α, m0 with γ fixed
Model fit to (long and short) interest rates: a and b
Model fit to total unemployed: kL/kU = u*
[Hence the "not bad for 5 parameters" title of the prediction updates since α is actually arbitrary depending on which year you normalize the price level.]

Interest rate model used the bound formulation (data ≤ model) based on non-ideal information transfer, however it only used a single function for the long and short interest rates.

Data used in fit:

  • NSA core CPI 1960 Q1 to 2013 Q4 (CPILFENS, as available March 2014)
  • 3-month secondary market rate 1960 Q1 to 2013 Q4 (WTB3MS, as available March 2014)
  • 10-year constant maturity rate 1960 Q1 to 2013 Q4 (DGS10, as available March 2014)
  • Unemployment level (UNEMPLOY), total employed (PAYEMS) and civilian labor force (CLF16OV) 1960 Q1 to 2013 Q4 (all as available March 2014)

Extrapolations (log-quadratic):

  • NGDP 2014 Q1 to 2015 Q4
  • M0 2014 Q1 to 2015 Q4
  • MB 2104 Q1 to 2015 Q4

Here's how the extrapolations have performed:


The monetary base came in a bit under the extrapolation.

Outputs:

  • Year over year core CPI (NSA)
  • RGDP
  • 3-month interest rate (bound and band)
  • 10-year interest rate (bound and band)
  • "Natural rate" of unemployment (just a single number u* = 5.7%)


There was a spike in short term rates this past summer -- likely stemming from talk of the Fed raising rates after the upcoming meeting.


There wasn't any noticeable pause in the blue region, so the metastability theory may not be correct. Or maybe we're heading directly to the utopian 4% green band that hasn't been realized since the 1990s.

Aside from the extrapolated paths, I had one other "caveat" that there wouldn't be any 'nominal (NGDP) shocks' in during the prediction period. Since these appeared to be unpredictable at the time (and only later did I come up with a tentative metric for determining whether shocks were likely), I had a plot of predicted value of NGDP shocks (based on NGDP and the model prediction from CPI):


Tuesday, August 18, 2015

Comparison of interest rate predictions


The decline [in long term interest rates] has come largely as a surprise. Financial markets and professional forecasters alike consistently failed to predict the secular shift, focusing too much on cyclical factors.
The above graph and quote are from this blog post by Obstfeld and Tesar (H/T John Cochrane) from July of this year.

I've been doing some time series forecasting using the information equilibrium (IE) model recently; how does the IE model compare to the Blue Chip Economic Indicators (BCEI)?

With the exception of 2005 (which is when the Fed embarked on its tightening before [1] the great recession) where the prediction is uncertain, the IE model does a much better job of forecasting 10-year nominal interest rates in the far future. The bands in the following are the 1-sigma errors (68% confidence limits).

1996

In this case, the IE model is a bit low in the near term, but better in the long term -- the opposite of the BCEI predictions.


2000 (1999)

In this case, I used 1999 as the prediction year instead of 2000 because the spike in base money due to fears of the 1999/2000 transition throws the model off. Even this does better than the (March of) 2000 BCEI predictions.


2005

This is the aforementioned case where the IE model becomes uncertain of the path of future rates and the Fed guides the economy between the high (initially) and low end (after the crisis) of the prediction bands.


2010

In this one, the IE model is spot on and far better than the BCEI prediction.


2015

We don't have the data yet, but I'd hazard a guess that the IE model predictions will be better than the BCEI predictions. If the Fed goes through with its projected short term rate increase in September-ish time period, it could impact this projection, but only if the Fed unwinds a large fraction of the QE in the short term.


PS

The information equilibrium model for interest rates is described here and here. In the notation I've used (described at the second link), we have the model (r → p) : N → M where N is NGDP, M is base money (minus reserves), r is the interest rate and p is the 'price of money'. In words, that model reads:
Aggregate demand (N) is in information equilibrium with base money (M). The quantity information flow from aggregate demand to aggregate supply (mediated by money) is measured by the price of money (p). That price is in information equilibrium with the nominal interest rate (r).

Update 8/19/2015:

The model (green line) shown in all of the graphs above is actually the model fit using all of the data from 1960 to 2015. However, the projections only use the model fit to the data from 1960 to the projection year (1996, 1999, 2005, 2010, 2015). This is visible in some of the projections above as the start point of the projection is noticeably off of the green line (2005 is the most visible, 1999 is the second most visible).

The model fit for 2015 is:
log r = k₁ log(N/M) - k₂
with
k₁ = 2.8
k₂ = 6.4

Using FRED series M = MBCURRCIR [converted from millions to billions of dollars], N = GDP and r = GS10.

You can have a look at the model here (with fit parameters):


Footnotes:

[1] I wanted to put "precipitating" instead of "before" because of some other considerations of the IE model, but went with the more neutral version.

Monday, August 3, 2015

Latest PCE inflation data

The new PCE inflation numbers are out and they've saved the NY Fed DSGE model from an ignominious early defeat. Granted, the probability was small that the information transfer model (ITM) would beat it in the first year (by "beat", I mean the DSGE model would be shown to be inconsistent with the data at roughly the 2-sigma level, not necessarily confirming the ITM).

Now we're just back to roughly a tie. Here is the updated graph (here's the previous update):


Thursday, July 30, 2015

Model prediction holding up for Japan as well

Noah Smith re-tweeted a tweet about Japan's price level, but in updating the results from here I still say it's the Keynesian component (not the monetary component):


Comparing NGDP predictions with results

Here's an update of the NGDP predictions from the information transfer model (gray line), and two log linear models (the "constant long run growth" and "new post-crisis normal") in red and the Hypermind NGDP prediction market (line segments, the green segment is the implicit prediction for Q3 and Q4 based on Q1 and Q2 results and the 2015 annual growth prediction):


Here are a couple of other graphs from the original prediction post as well:


Not much commentary ... everybody is doing fine.

Tuesday, June 2, 2015

Celebrating 500 posts with a predictive success

At 500 posts, I think I've accumulated enough stuff to cobble together a thesis.

Anyway, to celebrate I'll bring up an old prediction from a year ago: Canada would undershoot its inflation target by an increasing amount over time. And Canada has obliged:


This was an interesting prediction because Canada hadn't been undershooting in the past and the information transfer model predicted it would start undershooting -- and that it should become obvious by the end of 2015.

Apropos of 500, here's a post from the archives about 500 € notes.

Monday, June 1, 2015

NY Fed DSGE model predictions are not doing well

The latest core PCE inflation numbers are out for April 2015 (at FRED), so here's an update of the IT model prediction in the head-to-head with the NY Fed DSGE model. With the additional data points available since the last update, the NY Fed DSGE model has gone from performing terribly (relative to the IT model), to just performing poorly (relative to the IT model):


It is not yet statistically significant using some basic tests (the distribution of residuals), but comparing both models to an "ideal" model (dashed gray) based on an HP-like filter of the data (actually a LOESS filter, but these are roughly equivalent for some choice of smoothing parameters), the IT model (blue) is performing better than the DSGE model (red).


Actually, a constant model (inflation = constant, green dotted above) seems to be performing better than the NY Fed DSGE model at this point. The main problem is that the NY Fed DSGE model is showing the inflationary bias evident in both the market (from e.g. TIPS spreads) and the simple martingale model of adaptive expectations.

Wednesday, April 29, 2015

The new NGDP numbers are here ...

And the new GDP data is out! A pretty dismal performance ... but then the Atlanta Fed was saying Q1 seems to come in low these days (H/T to Cullen Roche who also had a good prediction), and in fact pretty much nailed the number with their GDPNow forecast.


I marked the Q1 numbers with blue dots on the prediction graph -- they do seem to have been systematically low since the financial crisis.

Overall: a continuing a trend of lukewarm economic performance, largely still in line with just about any model of the economy.

Tuesday, April 21, 2015

NGDP prediction updates

Nine days until the BEA releases its first estimate of Q1 NGDP. I've been updating the prediction graph with the predictions from hypermind linked at Scott Sumner's blog (see here, here) -- the Q1 prediction has been falling towards the advance estimates. And the advance estimates appear to be low ... in the area of 1.2% growth (see e.g. here).

The information equilibrium model doesn't get so detailed ... all of these estimates are within the error probability. Here's the original prediction. And here's the updated graph:


Here are the historical Hypermind predictions for Q1 NGDP growth:


You can clearly see the "update" that happens as 2014Q4 data is released at the end of January, as well as smaller "updates" around CPI inflation data releases at the beginning of each month.

Friday, March 13, 2015

Japan inflation update

The Q4 GDP number is available for Japan so here are the model updates including the new monetary and price level data. I've adjusted the Japanese core CPI for the VAT tax increases [1] in 1997 and 2014.

The prediction for Japan uses the same procedure as for the US predictions (see e.g. here), however I've integrated the inflation prediction errors to generate an error band for the price level (hence the size of the error will grow over time).

Here is the full (un-smoothed) model:


Here is the smoothed result:


And here is the prediction using the smoothed result:


Basically this prediction says inflation will be approximately zero for the next 10 years, barring any re-definition of the Yen.

Footnotes:

[1] Here are the unadjusted versions: