Paul Krugman has called the baby-sitting coop -- see here for original paper [pdf] -- his "favorite economic parable". It explains how recessions can be the result of poor monetary policy, that a lack of money (or in this case, baby-sitting scrip or coupons) can lead to lower output (fewer baby-sitting jobs). I've talked about it briefly before here. Let's put this parable into a formal information transfer model. Start with information equilibrium between the scrip (S), each coupon good for 30 minutes of babysitting, and the babysitting jobs (B).
P : B ⇄ S
Note that a babysitting job can potentially cost several coupons. That is our shorthand for a differential equation (see the paper) that has the solution (in general equilibrium):
B/B₀ = (S/S₀)ᵏ
The 'price level' is:
P = k (B₀/S₀) (S/S₀)ᵏ⁻¹
With this model, we have supply and demand curves in partial equilibrium where X stays near X* on the time scale that Y (the other process variable) changes (see the paper, with ΔX ≡ X - X₀):
Already we have some basic mechanics described in the paper and by Krugman:
- Depending on the value of k, the price level could be stable (k = 1), rise (k > 1, inflationary pressure) or fall (k < 1, deflation)
- If scrip S falls, then babysitting B will fall in general equilibrium. Printing more scrip will allow babysitting to rise.
However, there is another bit of dynamics not captured in the mainstream economic model version that is present in the information transfer framework. It's called non-ideal information transfer. In general, the information in the spatial and temporal distribution of babysitting jobs is greater than the information in the spatial-temporal distribution of scrip (not everyone who wants to babysit can babysit) so:
I(B) ≥ I(S)
P : B → S
P* ≤ k (B₀/S₀) (S/S₀)ᵏ⁻¹
And if B* is the non-ideal level of output and P is the ideal price level, then
P* S/k = B* ≤ B = P S/k
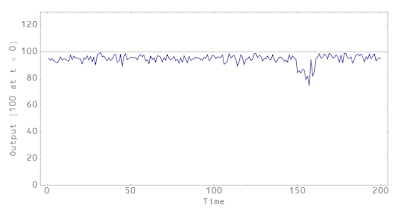
Which means you can have a recession without it being caused by a lack of scrip. And this should actually happen sometimes. If you say there are a lot of time periods (say weeks) and a lot of people in the babysitting coop, even random behavior will tend to saturate this bound. But occasionally, it will be less even if there is sufficient scrip. It could look something like this:
The line at 100 represents information equilibrium level of output B. At time t = 150, we have B* ≤ B (a recession) due to non-ideal information transfer. Now it doesn't have to be random behavior causing it (it still could be) -- it could be a broken market or some complex behavior such as a subset of the coop deciding to go out all at the same time. Or everyone works for the government and there's a shutdown (the coop story was originally in Washington DC).
Also, even the non-ideal information transfer could be alleviated by a temporary increase in the level of scrip (which moves the information equilibrium bound up):
The babysitting coop is traditionally used as an example of how nominal shocks (to the quantity of money) can have real effects on output, and how monetary policy can be useful in setting things right. The information equilibrium picture reproduces this basic picture. However it adds that recessions may also be caused by other factors (financial panics, wars, market failure, human behavior) that have nothing to do with monetary policy. Instead of the financial crisis being caused by tight money in 2008, it might not have been the Fed's fault at all.
Basically, the information transfer framework says that things like recessions may not arise out of the behavior of rational agents (which tend to produce information equilibrium results).


Bravo! :)
ReplyDeleteMore required reading for macroeconomists.
Thanks Bill.
DeleteJason maybe you covered this before in another one of your posts, but from the graphs you put in this post, you don't actually state what it is you plot, nor what your method is. May be helpful if you include these details (or at least a summary) whenever you make a new post about something.
ReplyDeleteHi Todd,
DeleteNot sure which graphs you are referring to ... the last two graphs are more of a cartoon picture where B* ≈ B (but still less than B) and then B* < B.
OK first babysitter graph- what exactly is being graphed on the lower blue line- I assume some kind of random distribution of babysitters? Also, the "recession" I assume is just stochastic- it happens when the randomly assigned distribution of babysitters just mostly happen to lack work at a particular time?
DeleteAnd how much is the amount of scrip increased by in the second babysitter graph that reduces the "recession"?
thanks, cheers!
I should have drawn it by hand to emphasize that it's a stylized representation, like the graph here:
Deletehttp://informationtransfereconomics.blogspot.com/2015/09/the-price-revolution-and-non-ideal.html
There is no model behind it. I just took some small random numbers and subtracted them from 100. The recession "turns on" and subtracts some larger random numbers between timestep 150 and 160.
In the second graph, I do the same thing but subtract them from 110 during the period 150 to 160. Since the larger random numbers are about 10, that balances out.
It's graphing B* (blue line) = measured babysitting output. The flat line is "B", the ideal value.
OK thanks, makes sense now. Physicists seem to not need an explanation of the methods that lead to results nearly as much as us natural scientists.
DeletePhysicists are natural scientists :)
DeleteThe graphs above represent illustrations, not results. You don't need to know how this "result" was produced:
http://i.space.com/images/i/000/045/948/i02/universe-timeline.jpg?1425052475
It's quite literally the same thing ... just much less pretty.